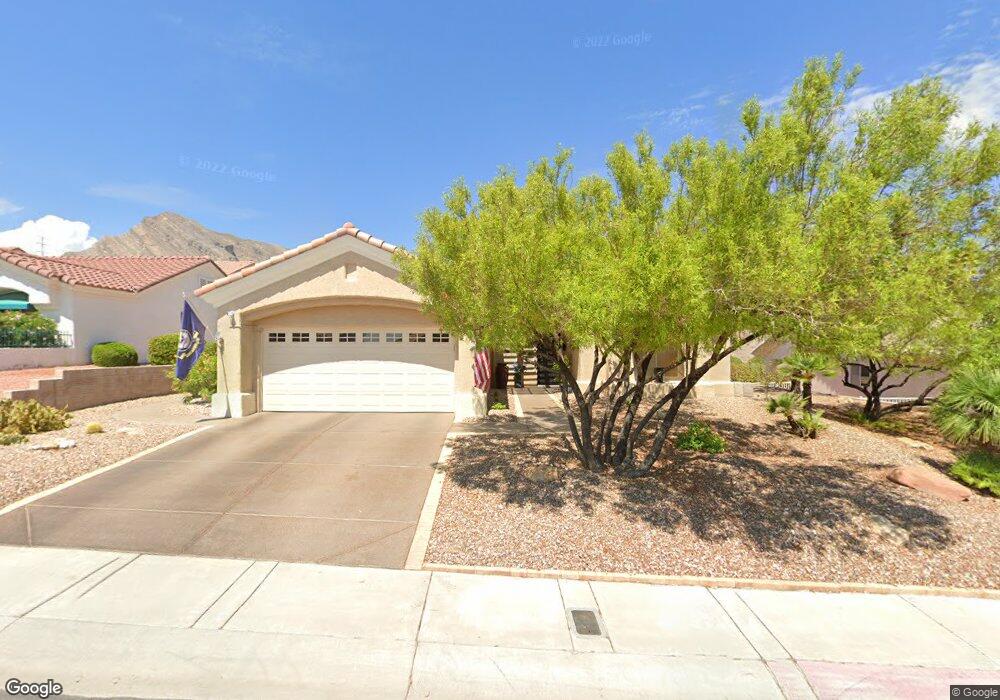
2913 Faiss Dr Unit 43 Las Vegas, NV 89134
Sun City Summerlin NeighborhoodEstimated Value: $510,000 - $579,000
2
Beds
2
Baths
1,533
Sq Ft
$356/Sq Ft
Est. Value
About This Home
This home is located at 2913 Faiss Dr Unit 43, Las Vegas, NV 89134 and is currently estimated at $546,056, approximately $356 per square foot. 2913 Faiss Dr Unit 43 is a home located in Clark County with nearby schools including William Lummis Elementary School, Ernest Becker Middle School, and Palo Verde High School.
Ownership History
Date
Name
Owned For
Owner Type
Purchase Details
Closed on
Sep 22, 2014
Sold by
Price Donald R and Price Patricia
Bought by
The Donald R And Patricia A Price Trust
Current Estimated Value
Purchase Details
Closed on
Apr 13, 2003
Sold by
Kadien Francis Xavior and Kadien Diana Nancy
Bought by
Price Donald R and Price Patricia
Home Financials for this Owner
Home Financials are based on the most recent Mortgage that was taken out on this home.
Original Mortgage
$169,600
Outstanding Balance
$71,735
Interest Rate
5.54%
Estimated Equity
$474,321
Purchase Details
Closed on
May 7, 2002
Sold by
Kadien Francis X and Kadien Diana N
Bought by
Kadien Francis Xavior and Kadien Diana Nancy
Purchase Details
Closed on
Mar 1, 1995
Sold by
Del Webb Communities Inc
Bought by
Kadien Francis X and Kadien Diana N
Create a Home Valuation Report for This Property
The Home Valuation Report is an in-depth analysis detailing your home's value as well as a comparison with similar homes in the area
Home Values in the Area
Average Home Value in this Area
Purchase History
| Date | Buyer | Sale Price | Title Company |
|---|---|---|---|
| The Donald R And Patricia A Price Trust | -- | None Available | |
| Price Donald R | $212,000 | Old Republic Title Company | |
| Kadien Francis Xavior | -- | -- | |
| Kadien Francis X | $166,000 | First American Title Company |
Source: Public Records
Mortgage History
| Date | Status | Borrower | Loan Amount |
|---|---|---|---|
| Open | Price Donald R | $169,600 |
Source: Public Records
Tax History Compared to Growth
Tax History
| Year | Tax Paid | Tax Assessment Tax Assessment Total Assessment is a certain percentage of the fair market value that is determined by local assessors to be the total taxable value of land and additions on the property. | Land | Improvement |
|---|---|---|---|---|
| 2025 | $3,095 | $120,397 | $46,200 | $74,197 |
| 2024 | $2,902 | $120,397 | $46,200 | $74,197 |
| 2023 | $2,902 | $112,249 | $42,000 | $70,249 |
| 2022 | $2,553 | $99,813 | $35,000 | $64,813 |
| 2021 | $2,478 | $90,365 | $28,700 | $61,665 |
| 2020 | $2,403 | $90,027 | $28,700 | $61,327 |
| 2019 | $2,333 | $84,723 | $24,150 | $60,573 |
| 2018 | $2,265 | $79,041 | $20,300 | $58,741 |
| 2017 | $2,559 | $77,194 | $18,200 | $58,994 |
| 2016 | $2,145 | $75,199 | $16,100 | $59,099 |
| 2015 | $2,141 | $70,900 | $13,300 | $57,600 |
| 2014 | $2,067 | $66,827 | $11,550 | $55,277 |
Source: Public Records
Map
Nearby Homes
- 2928 Big Green Ln
- 2913 Darby Falls Dr
- 10505 Linden Wood Ct
- 2755 Faiss Dr
- 2853 Breakers Creek Dr
- 10713 Paradise Point Dr
- 2913 Laverton Dr
- 2910 Raywood Ash Dr
- 2712 Breakers Creek Dr
- 2805 Hanging Rock Dr
- 2621 Breakers Creek Dr
- 2739 Darby Falls Dr
- 2621 Hanging Rock Dr
- 10428 Villa Ridge Dr
- 2736 Darby Falls Dr
- 10850 Organic Dr
- 2728 Faiss Dr
- 2620 Hanging Rock Dr
- 3028 Treesdale Dr
- 3041 Raywood Ash Dr
- 2917 Faiss Dr
- 2909 Faiss Dr
- 2916 Big Green Ln
- 2912 Big Green Ln
- 2921 Faiss Dr
- 2920 Big Green Ln
- 2908 Big Green Ln
- 2912 Faiss Dr
- 2916 Faiss Dr
- 2908 Faiss Dr
- 2925 Faiss Dr
- 2901 Faiss Dr Unit 43
- 2924 Big Green Ln
- 2920 Faiss Dr
- 2904 Big Green Ln
- 2904 Faiss Dr
- 2915 Big Green Ln
- 2917 Big Green Ln Unit 43
- 2929 Faiss Dr
- 2913 Big Green Ln