2913 Grey Heron Ct Johnsburg, IL 60051
Estimated payment $379/month
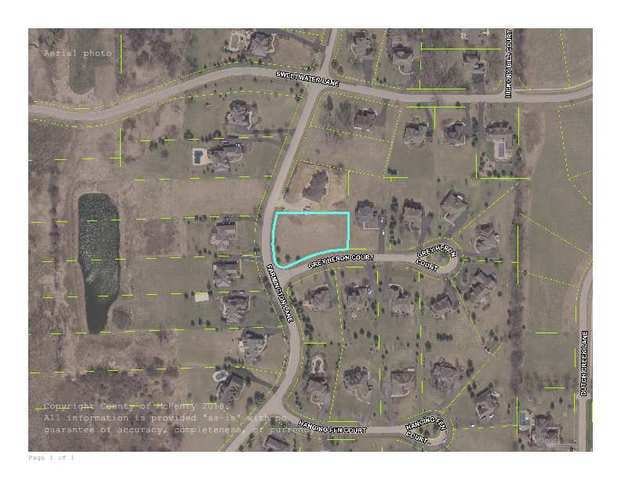
About This Lot
Mostly level corner lot in prestigious Dutch Creek Estates located in the established phase 2 section. Surrounded by large custom homes on large lots. Perc test and survey on file, as well as architectural plans. The owners have been relocated, but had planned to build their dream house here! Suitable for a circular drive and an English basement is possible. Premium location across the street from lots that have sold for $100,000 or more. This property sold for $120,000 in 2007, and we're still priced at less than half of its peak value!!
Property Details
Property Type
- Land
Est. Annual Taxes
- $1,778
Lot Details
- 0.83 Acre Lot
- Lot Dimensions are 160 x 235
- Property is zoned SINGL
Schools
- Johnsburg High School
Utilities
- Well Required
- Septic Needed
Map
Home Values in the Area
Average Home Value in this Area
Tax History
| Year | Tax Paid | Tax Assessment Tax Assessment Total Assessment is a certain percentage of the fair market value that is determined by local assessors to be the total taxable value of land and additions on the property. | Land | Improvement |
|---|---|---|---|---|
| 2024 | $1,803 | $25,651 | $25,651 | -- |
| 2023 | $1,778 | $22,981 | $22,981 | -- |
| 2022 | $1,698 | $21,320 | $21,320 | $0 |
| 2021 | $1,626 | $19,855 | $19,855 | $0 |
| 2020 | $1,582 | $19,027 | $19,027 | $0 |
| 2019 | $1,564 | $18,068 | $18,068 | $0 |
| 2018 | $1,752 | $19,841 | $19,841 | $0 |
| 2017 | $1,713 | $18,621 | $18,621 | $0 |
| 2016 | $1,703 | $17,403 | $17,403 | $0 |
| 2013 | -- | $17,134 | $17,134 | $0 |
Property History
| Date | Event | Price | List to Sale | Price per Sq Ft | Prior Sale |
|---|---|---|---|---|---|
| 08/14/2024 08/14/24 | For Sale | $44,900 | +12.3% | -- | |
| 05/26/2016 05/26/16 | Sold | $40,000 | -49.9% | -- | View Prior Sale |
| 04/22/2016 04/22/16 | Pending | -- | -- | -- | |
| 12/30/2010 12/30/10 | For Sale | $79,899 | -- | -- |
Purchase History
| Date | Type | Sale Price | Title Company |
|---|---|---|---|
| Quit Claim Deed | -- | -- | |
| Special Warranty Deed | $40,000 | Fidelity National Title | |
| Sheriffs Deed | -- | None Available | |
| Warranty Deed | $120,000 | Landamerica-Lawyers Title | |
| Warranty Deed | $60,300 | Ticor | |
| Deed | $52,440 | Ticor |
Mortgage History
| Date | Status | Loan Amount | Loan Type |
|---|---|---|---|
| Previous Owner | $495,760 | Construction | |
| Previous Owner | $24,000 | Unknown |
Source: Midwest Real Estate Data (MRED)
MLS Number: 12137909
APN: 09-12-353-007
Disclaimer: Certain information contained herein is derived from information provided by parties other than Homes.com. All information provided is deemed reliable, but is not guaranteed to be accurate and should be independently verified.
![]() Based on information submitted to the MLS GRID. All data is obtained from various sources and may not have been verified by broker or MLS GRID. Supplied Open House Information is subject to change without notice. All information should be independently reviewed and verified for accuracy. Properties may or may not be listed by the office/agent presenting the information. Some IDX listings have been excluded from this website.
Based on information submitted to the MLS GRID. All data is obtained from various sources and may not have been verified by broker or MLS GRID. Supplied Open House Information is subject to change without notice. All information should be independently reviewed and verified for accuracy. Properties may or may not be listed by the office/agent presenting the information. Some IDX listings have been excluded from this website.
Based on information submitted to the MLS GRID
- 4206 Farmington Ln
- 0 Sweet Water Ln
- 4507 Red Tail Ln
- 4407 Red Tail Ln
- 4307 Red Tail Ln
- 4403 Red Tail Ln
- 4311 Red Tail Ln
- 4411 Red Tail Ln
- 2904 Fox Knoll Ct
- 2917 Fox Knoll Ct
- 0000 Johnsburg Rd
- 3.8 Ac Johnsburg Rd
- 4414 Preservation Ct
- 4506 Preservation Ct
- 4502 Preservation Ct
- 4406 Preservation Ct
- 4407 Preservation Ct
- 4410 Preservation Ct
- 4403 Preservation Ct
- 3701 Spring Grove Rd
- 3607 Johnsburg Rd
- 3415 Blake Blvd
- 2310 Truman Trail
- 1941 N Orleans St
- 3407 Venice Ave Unit SI ID1374787P
- 3534 Waukegan Rd
- 811 N River Rd Unit SI ID1306762P
- 306 Waverly St Unit SI ID1244943P
- 35831 N Cedar Island Unit SI ID1306579P
- 37648 N Lake Vista Terrace
- 10 N Pistakee Lake Rd Unit SI ID1374789P
- 4502-4518 Garden Quarter Rd
- 4015 W Kane Ave Unit 3C
- 525 Circle Dr Unit SI ID1374784P
- 45 Ernest Ave
- 514 Park Ave
- 115 Nippersink Blvd Unit 205
- 3 Lilac Ave
- 6561 Sassafras Way Unit E
- 28600 W Grass Lake Rd Unit 1B

Ask me questions while you tour the home.