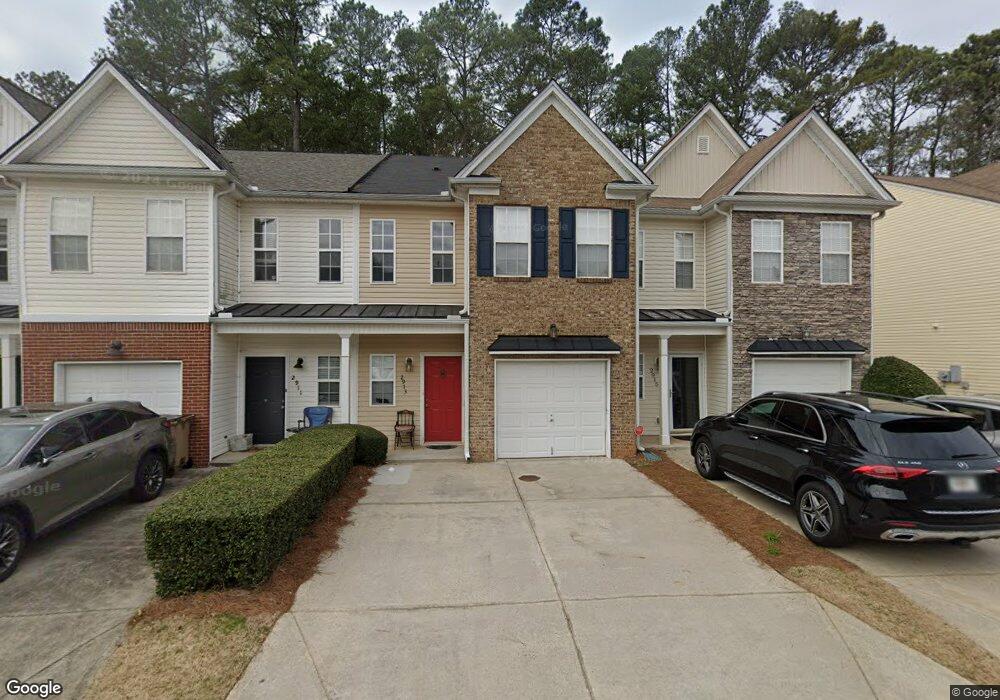
2913 Greyhawk Ln Unit 2913 Cumming, GA 30040
Estimated Value: $321,000 - $365,000
2
Beds
3
Baths
1,724
Sq Ft
$202/Sq Ft
Est. Value
About This Home
This home is located at 2913 Greyhawk Ln Unit 2913, Cumming, GA 30040 and is currently estimated at $348,321, approximately $202 per square foot. 2913 Greyhawk Ln Unit 2913 is a home located in Forsyth County with nearby schools including Piney Grove Middle School, Denmark High School, and Alpharetta Tamil School.
Ownership History
Date
Name
Owned For
Owner Type
Purchase Details
Closed on
Nov 6, 2024
Sold by
Beneficiary Trust For Lynn Erin Cole and Cole Lynn Erin
Bought by
Tucker Lynn Erin Cole
Current Estimated Value
Purchase Details
Closed on
Jul 13, 2020
Sold by
Cole Jeffrey
Bought by
Cole Lynn Erin Trust
Purchase Details
Closed on
Oct 30, 2006
Sold by
Matzura Thomas
Bought by
Muller Richard V and Muller Jeanne B
Home Financials for this Owner
Home Financials are based on the most recent Mortgage that was taken out on this home.
Original Mortgage
$104,600
Interest Rate
6.31%
Mortgage Type
New Conventional
Purchase Details
Closed on
Feb 27, 2002
Sold by
Bowen Builders Group Inc
Bought by
Marzura Thomas
Home Financials for this Owner
Home Financials are based on the most recent Mortgage that was taken out on this home.
Original Mortgage
$101,900
Interest Rate
6.98%
Mortgage Type
New Conventional
Create a Home Valuation Report for This Property
The Home Valuation Report is an in-depth analysis detailing your home's value as well as a comparison with similar homes in the area
Home Values in the Area
Average Home Value in this Area
Purchase History
| Date | Buyer | Sale Price | Title Company |
|---|---|---|---|
| Tucker Lynn Erin Cole | -- | None Listed On Document | |
| Tucker Lynn Erin Cole | -- | None Listed On Document | |
| Cole Lynn Erin Trust | -- | -- | |
| Muller Richard V | $139,500 | -- | |
| Marzura Thomas | $131,900 | -- |
Source: Public Records
Mortgage History
| Date | Status | Borrower | Loan Amount |
|---|---|---|---|
| Previous Owner | Muller Richard V | $104,600 | |
| Previous Owner | Marzura Thomas | $101,900 |
Source: Public Records
Tax History Compared to Growth
Tax History
| Year | Tax Paid | Tax Assessment Tax Assessment Total Assessment is a certain percentage of the fair market value that is determined by local assessors to be the total taxable value of land and additions on the property. | Land | Improvement |
|---|---|---|---|---|
| 2025 | $3,440 | $145,548 | $66,000 | $79,548 |
| 2024 | $3,440 | $140,284 | $66,000 | $74,284 |
| 2023 | $2,724 | $130,176 | $56,000 | $74,176 |
| 2022 | $2,683 | $85,792 | $32,000 | $53,792 |
| 2021 | $2,369 | $85,792 | $32,000 | $53,792 |
| 2020 | $2,137 | $77,400 | $24,000 | $53,400 |
| 2019 | $2,130 | $77,012 | $24,000 | $53,012 |
| 2018 | $1,986 | $71,824 | $20,000 | $51,824 |
| 2017 | $1,678 | $60,452 | $20,000 | $40,452 |
| 2016 | $1,567 | $56,452 | $16,000 | $40,452 |
| 2015 | $1,408 | $50,652 | $16,000 | $34,652 |
| 2014 | $1,302 | $49,184 | $0 | $0 |
Source: Public Records
Map
Nearby Homes
- 2913 Greyhawk Ln
- 2945 Greyhawk Ln Unit 3
- 2951 Greyhawk Ln
- 2872 Cross Creek Ct
- 2964 Greyhawk Ln Unit 160
- 3211 Glen Wallace Dr
- 2892 Cross Creek Dr
- 3080 Whitfield Ave
- 2881 Cross Creek Dr Unit 162
- 3705 Baguette Ct Unit 101
- 3715 Baguette Ct Unit 102
- 2702 Wollerton St Unit 2702
- 2503 Wollerton St Unit 2503
- 1001 Calypso Way Unit 1001
- 3112 Cross Creek Dr Unit 68
- 1601 Bonica Crossing Rd Unit 1601
- 6410 Oak Valley Dr
- 1702 Bonica Crossing Unit 1702
- Kendrick Plan at Courtyards at Traditions
- Redford Plan at Courtyards at Traditions
- 2911 Greyhawk Ln Unit 2911
- 2911 Greyhawk Ln
- 2915 Greyhawk Ln Unit None
- 2915 Greyhawk Ln
- 2909 Greyhawk Ln Unit 1 B
- 2909 Greyhawk Ln
- 2917 Greyhawk Ln
- 2919 Greyhawk Ln
- 2907 Greyhawk Ln
- 2907 Greyhawk Ln Unit 2907
- 2921 Greyhawk Ln
- 2905 Greyhawk Ln
- 2912 Greyhawk Ln
- 2910 Greyhawk Ln
- 2914 Greyhawk Ln
- 2923 Greyhawk Ln
- 2923 Greyhawk Ln
- 2908 Greyhawk Ln
- 2903 Greyhawk Ln
- 2916 Greyhawk Ln