Estimated Value: $378,000 - $424,000
4
Beds
3
Baths
2,708
Sq Ft
$148/Sq Ft
Est. Value
About This Home
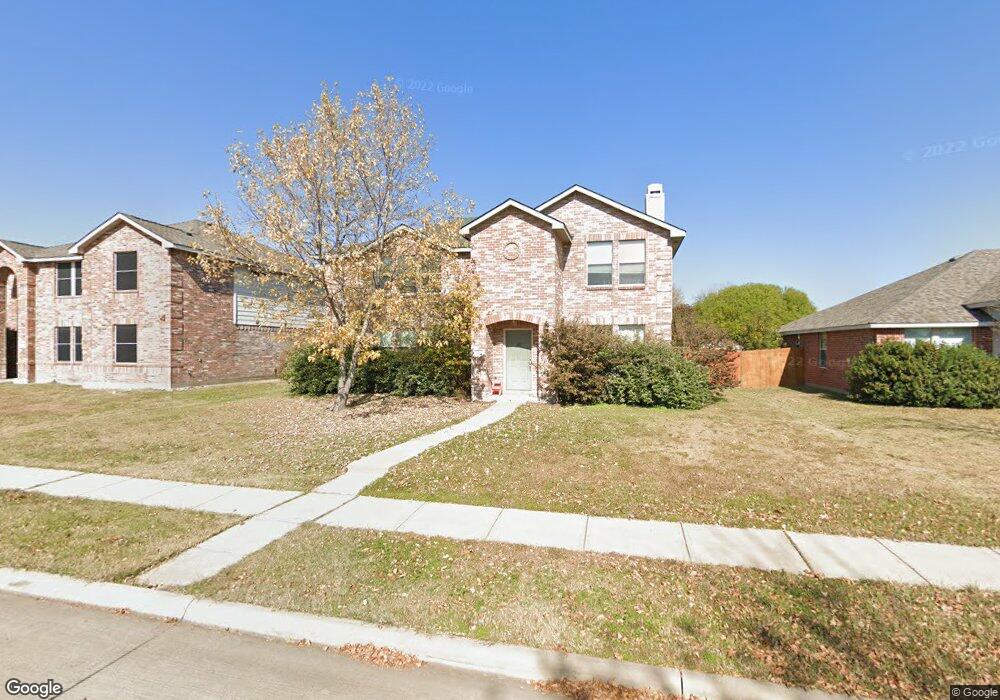
This home is located at 2913 Jamestown Dr, Wylie, TX 75098 and is currently estimated at $400,638, approximately $147 per square foot. 2913 Jamestown Dr is a home located in Collin County with nearby schools including P M Akin Elementary School, AB Harrison Intermediate School, and Grady Burnett J High School.
Ownership History
Date
Name
Owned For
Owner Type
Purchase Details
Closed on
Jul 8, 2019
Sold by
Opendoor Property J Llc
Bought by
Ruiz Abraham and Ruiz Jorgelina
Current Estimated Value
Home Financials for this Owner
Home Financials are based on the most recent Mortgage that was taken out on this home.
Original Mortgage
$247,350
Outstanding Balance
$217,496
Interest Rate
4%
Mortgage Type
New Conventional
Estimated Equity
$183,142
Purchase Details
Closed on
Mar 29, 2019
Sold by
Austin Stephen Earl and Austin Carrol Joann
Bought by
Opendoor Property J Llc
Purchase Details
Closed on
Aug 13, 2003
Sold by
Centex Homes
Bought by
Austin Stephen Earl and Austin Carrol Joann
Home Financials for this Owner
Home Financials are based on the most recent Mortgage that was taken out on this home.
Original Mortgage
$155,040
Interest Rate
5.35%
Mortgage Type
VA
Create a Home Valuation Report for This Property
The Home Valuation Report is an in-depth analysis detailing your home's value as well as a comparison with similar homes in the area
Home Values in the Area
Average Home Value in this Area
Purchase History
| Date | Buyer | Sale Price | Title Company |
|---|---|---|---|
| Ruiz Abraham | -- | None Available | |
| Opendoor Property J Llc | -- | None Available | |
| Austin Stephen Earl | -- | -- |
Source: Public Records
Mortgage History
| Date | Status | Borrower | Loan Amount |
|---|---|---|---|
| Open | Ruiz Abraham | $247,350 | |
| Previous Owner | Austin Stephen Earl | $155,040 |
Source: Public Records
Tax History Compared to Growth
Tax History
| Year | Tax Paid | Tax Assessment Tax Assessment Total Assessment is a certain percentage of the fair market value that is determined by local assessors to be the total taxable value of land and additions on the property. | Land | Improvement |
|---|---|---|---|---|
| 2025 | $6,322 | $379,100 | $90,000 | $289,100 |
| 2024 | $6,322 | $385,988 | $90,000 | $295,988 |
| 2023 | $6,322 | $388,349 | $95,000 | $293,349 |
| 2022 | $7,824 | $356,622 | $75,000 | $281,622 |
| 2021 | $6,116 | $259,941 | $55,000 | $204,941 |
| 2020 | $6,265 | $252,321 | $55,000 | $197,321 |
| 2019 | $5,668 | $215,675 | $55,000 | $183,344 |
| 2018 | $5,280 | $196,068 | $50,000 | $187,098 |
| 2017 | $4,800 | $225,900 | $45,000 | $180,900 |
| 2016 | $4,502 | $203,882 | $35,000 | $168,882 |
| 2015 | $4,294 | $147,309 | $35,000 | $112,309 |
Source: Public Records
Map
Nearby Homes
- 2800 Gold Hill Dr
- 2601 Waverly Dr
- 2603 Waverly Dr
- 2605 Waverly Dr
- 2607 Waverly Dr
- 2606 Waverly Dr
- 2608 Waverly Dr
- Santa Fe Plan at Kreymer at the Park
- Omaha Plan at Kreymer at the Park
- Glasgow Plan at Kreymer at the Park
- Mykonos Plan at Kreymer at the Park
- Malmo Plan at Kreymer at the Park
- Cordoba Plan at Kreymer at the Park
- Rotterdam Plan at Kreymer at the Park
- 2601 Ackley Ln
- 2603 Ackley Ln
- 2609 Ackley Ln
- 209 Duck Blind Ave
- 211 Rutherford Ave
- 2415 Ray Roberts Dr
- 2915 Jamestown Dr
- 2909 Jamestown Dr
- 2917 Jamestown Dr
- 2912 Glendale Dr
- 2914 Glendale Dr
- 2910 Glendale Dr
- 2912 Jamestown Dr
- 2914 Jamestown Dr
- 2916 Glendale Dr
- 2907 Jamestown Dr
- 2919 Jamestown Dr
- 2908 Glendale Dr
- 2916 Jamestown Dr
- 2910 Jamestown Dr
- 2918 Glendale Dr
- 2918 Jamestown Dr
- 2908 Jamestown Dr
- 2906 Glendale Dr
- 2905 Jamestown Dr
- 2921 Jamestown Dr