Estimated Value: $492,130 - $515,000
4
Beds
3
Baths
3,026
Sq Ft
$166/Sq Ft
Est. Value
About This Home
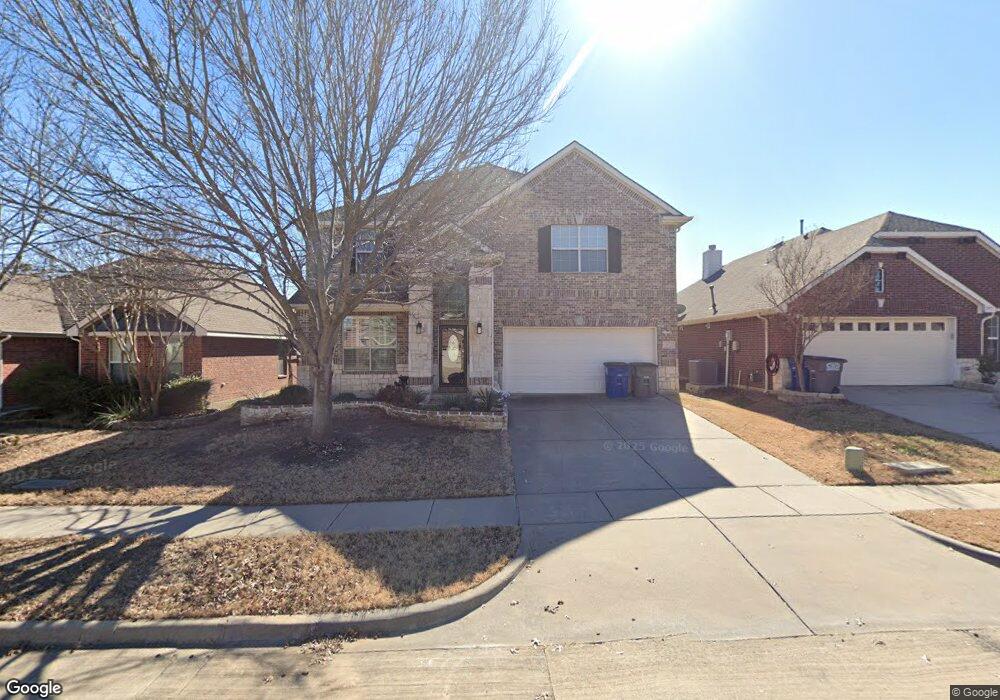
This home is located at 2913 Mason Ln, Wylie, TX 75098 and is currently estimated at $503,533, approximately $166 per square foot. 2913 Mason Ln is a home located in Collin County with nearby schools including R V Groves Elementary School, Dr. Al Draper Intermediate Middle School, and Raymond B Cooper J High School.
Ownership History
Date
Name
Owned For
Owner Type
Purchase Details
Closed on
Oct 15, 2021
Sold by
Misra Surjya N and Panigrahi Ankita
Bought by
Camplen Carl and Camplen Vanessa
Current Estimated Value
Home Financials for this Owner
Home Financials are based on the most recent Mortgage that was taken out on this home.
Original Mortgage
$407,483
Outstanding Balance
$371,586
Interest Rate
2.8%
Mortgage Type
FHA
Estimated Equity
$131,947
Purchase Details
Closed on
Jan 28, 2008
Sold by
Ashton Dallas Residential Llc
Bought by
Misra Surjya N
Home Financials for this Owner
Home Financials are based on the most recent Mortgage that was taken out on this home.
Original Mortgage
$171,728
Interest Rate
6.15%
Mortgage Type
Purchase Money Mortgage
Create a Home Valuation Report for This Property
The Home Valuation Report is an in-depth analysis detailing your home's value as well as a comparison with similar homes in the area
Home Values in the Area
Average Home Value in this Area
Purchase History
| Date | Buyer | Sale Price | Title Company |
|---|---|---|---|
| Camplen Carl | -- | Capital Title | |
| Misra Surjya N | -- | Stnt |
Source: Public Records
Mortgage History
| Date | Status | Borrower | Loan Amount |
|---|---|---|---|
| Open | Camplen Carl | $407,483 | |
| Previous Owner | Misra Surjya N | $171,728 |
Source: Public Records
Tax History Compared to Growth
Tax History
| Year | Tax Paid | Tax Assessment Tax Assessment Total Assessment is a certain percentage of the fair market value that is determined by local assessors to be the total taxable value of land and additions on the property. | Land | Improvement |
|---|---|---|---|---|
| 2025 | $8,021 | $469,662 | $125,000 | $344,662 |
| 2024 | $8,021 | $473,085 | $125,000 | $348,085 |
| 2023 | $8,021 | $458,464 | $110,000 | $381,600 |
| 2022 | $9,144 | $416,785 | $90,000 | $326,785 |
| 2021 | $8,000 | $340,000 | $70,000 | $270,000 |
| 2020 | $7,784 | $313,481 | $65,000 | $248,481 |
| 2019 | $8,434 | $320,949 | $65,000 | $255,949 |
| 2018 | $8,282 | $307,539 | $65,000 | $242,539 |
| 2017 | $8,123 | $301,620 | $60,000 | $241,620 |
| 2016 | $7,335 | $264,000 | $50,000 | $214,000 |
| 2015 | $6,335 | $242,945 | $40,000 | $202,945 |
Source: Public Records
Map
Nearby Homes
- 2907 Abby Ln
- 2912 Katie Cir
- 1205 Periwinkle Dr
- 307 Wooded Creek Ave
- 3014 Eastwood Dr
- 3119 Connor Ln
- 310 Admiral Dr
- 3105 Admiral Dr
- 563 John Ross Rd
- 2615 Gum Tree Trail
- 802 Appalachian Dr
- 3003 Candlebrook Dr
- 3111 Candlebrook Dr
- Iris Plan at Wooded Creek
- Beckett II Plan at Wooded Creek
- Annabelle III Plan at Wooded Creek
- 2606 Parkbridge Ct
- 3017 Eagle Mountain Dr
- 3103 Creekwood Dr
- 101 Gary Way