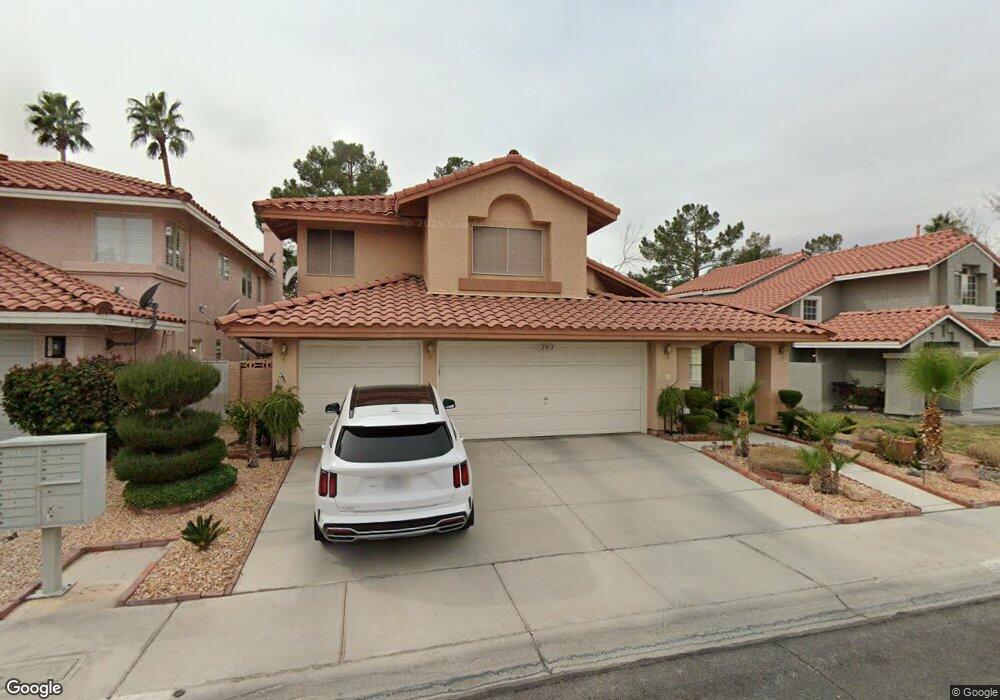
2913 Moonlight Bay Ln Las Vegas, NV 89128
Desert Shores NeighborhoodEstimated Value: $549,000 - $588,000
4
Beds
3
Baths
2,171
Sq Ft
$260/Sq Ft
Est. Value
About This Home
This home is located at 2913 Moonlight Bay Ln, Las Vegas, NV 89128 and is currently estimated at $565,050, approximately $260 per square foot. 2913 Moonlight Bay Ln is a home located in Clark County with nearby schools including Dorothy Eisenberg Elementary School, Marc Kahre Elementary School, and Ernest Becker Middle School.
Ownership History
Date
Name
Owned For
Owner Type
Purchase Details
Closed on
Apr 13, 2005
Sold by
Campbell Joan L
Bought by
Hodges Randall Scott and Hodges Teresita Roy
Current Estimated Value
Home Financials for this Owner
Home Financials are based on the most recent Mortgage that was taken out on this home.
Original Mortgage
$300,000
Outstanding Balance
$105,772
Interest Rate
1%
Mortgage Type
Fannie Mae Freddie Mac
Estimated Equity
$459,278
Purchase Details
Closed on
Apr 17, 2002
Sold by
Alberici John Samuel and Alberici Patricia Ann
Bought by
Campbell Joan L
Home Financials for this Owner
Home Financials are based on the most recent Mortgage that was taken out on this home.
Original Mortgage
$149,900
Interest Rate
7.08%
Purchase Details
Closed on
Mar 9, 2001
Sold by
Alberici John Samuel and Alberici Patricia Ann
Bought by
Trust Of John Samuel Ablerici & Patrici
Create a Home Valuation Report for This Property
The Home Valuation Report is an in-depth analysis detailing your home's value as well as a comparison with similar homes in the area
Home Values in the Area
Average Home Value in this Area
Purchase History
| Date | Buyer | Sale Price | Title Company |
|---|---|---|---|
| Hodges Randall Scott | $375,000 | National Title Company | |
| Campbell Joan L | $218,000 | Fidelity National Title | |
| Trust Of John Samuel Ablerici & Patrici | -- | -- |
Source: Public Records
Mortgage History
| Date | Status | Borrower | Loan Amount |
|---|---|---|---|
| Open | Hodges Randall Scott | $300,000 | |
| Previous Owner | Campbell Joan L | $149,900 |
Source: Public Records
Tax History Compared to Growth
Tax History
| Year | Tax Paid | Tax Assessment Tax Assessment Total Assessment is a certain percentage of the fair market value that is determined by local assessors to be the total taxable value of land and additions on the property. | Land | Improvement |
|---|---|---|---|---|
| 2025 | $2,435 | $112,952 | $42,700 | $70,252 |
| 2024 | $2,364 | $112,952 | $42,700 | $70,252 |
| 2023 | $2,364 | $106,882 | $39,550 | $67,332 |
| 2022 | $2,301 | $93,736 | $31,500 | $62,236 |
| 2021 | $2,236 | $88,561 | $29,050 | $59,511 |
| 2020 | $2,167 | $88,743 | $29,400 | $59,343 |
| 2019 | $2,233 | $84,805 | $25,900 | $58,905 |
| 2018 | $2,043 | $79,382 | $22,400 | $56,982 |
| 2017 | $2,544 | $80,121 | $22,050 | $58,071 |
| 2016 | $1,910 | $73,264 | $14,700 | $58,564 |
| 2015 | $1,907 | $71,639 | $14,000 | $57,639 |
| 2014 | $1,851 | $59,871 | $10,500 | $49,371 |
Source: Public Records
Map
Nearby Homes
- 2908 Channel Bay Dr
- 2908 Reef Bay Ln
- 3012 Windy Surf Ct
- 3004 Red Bay Way
- 3125 N Buffalo Dr Unit 2102
- 3125 N Buffalo Dr Unit 1088
- 3125 N Buffalo Dr Unit 1136
- 3125 N Buffalo Dr Unit 2156
- 3125 N Buffalo Dr Unit 1078
- 3125 N Buffalo Dr Unit 2153
- 3125 N Buffalo Dr Unit 1090
- 3125 N Buffalo Dr Unit 2104
- 3125 N Buffalo Dr Unit 1103
- 3125 N Buffalo Dr Unit 2103
- 3125 N Buffalo Dr Unit 1160
- 3125 N Buffalo Dr Unit 1089
- 3150 Soft Breezes Dr Unit 2220
- 3150 Soft Breezes Dr Unit 2218
- 3150 Soft Breezes Dr Unit 2186
- 3150 Soft Breezes Dr Unit 1034
- 2917 Moonlight Bay Ln
- 2909 Moonlight Bay Ln
- 2912 Moonlight Bay Ln
- 2908 Moonlight Bay Ln
- 2916 Moonlight Bay Ln
- 2904 Moonlight Bay Ln
- 2881 Moonlight Bay Ln
- 2881 Moonlight Bay Ln Unit na
- 7652 Botany Bay Dr Unit o
- 7652 Botany Bay Dr
- 2856 Cape Verde Ln
- 2860 Cape Verde Ln
- 2900 Moonlight Bay Ln
- 2852 Cape Verde Ln
- 7648 Botany Bay Dr
- 7637 Botany Bay Dr
- 2877 Moonlight Bay Ln
- 2884 Moonlight Bay Ln
- 7644 Botany Bay Dr
- 2868 Cape Verde Ln