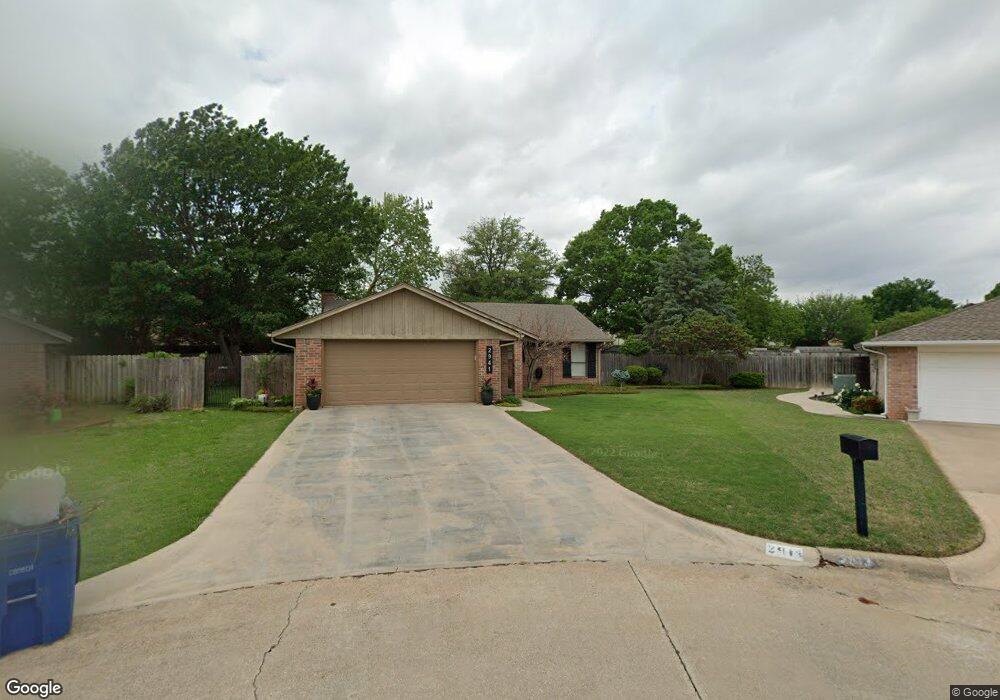
2913 Nola Ct Duncan, OK 73533
Estimated Value: $189,000 - $222,000
3
Beds
2
Baths
1,584
Sq Ft
$128/Sq Ft
Est. Value
About This Home
This home is located at 2913 Nola Ct, Duncan, OK 73533 and is currently estimated at $202,100, approximately $127 per square foot. 2913 Nola Ct is a home located in Stephens County with nearby schools including Horace Mann Elementary School, Duncan Middle School, and Duncan High School.
Ownership History
Date
Name
Owned For
Owner Type
Purchase Details
Closed on
Jun 2, 2023
Sold by
Gregston Jillian J
Bought by
Kreutz Kirsten E and Kreutz Pedro M
Current Estimated Value
Home Financials for this Owner
Home Financials are based on the most recent Mortgage that was taken out on this home.
Original Mortgage
$162,000
Outstanding Balance
$151,922
Interest Rate
6.39%
Mortgage Type
New Conventional
Estimated Equity
$50,178
Purchase Details
Closed on
Mar 10, 2021
Sold by
Churchman Brian and Churchman Ruth Ann
Bought by
Gregston Jillian J
Home Financials for this Owner
Home Financials are based on the most recent Mortgage that was taken out on this home.
Original Mortgage
$143,993
Interest Rate
2.7%
Mortgage Type
FHA
Purchase Details
Closed on
Jul 7, 1994
Sold by
Red River Vo-Tech #19
Bought by
Churchman Brian and Ruth Ann
Purchase Details
Closed on
Jul 8, 1993
Sold by
Smith Richard T
Create a Home Valuation Report for This Property
The Home Valuation Report is an in-depth analysis detailing your home's value as well as a comparison with similar homes in the area
Home Values in the Area
Average Home Value in this Area
Purchase History
| Date | Buyer | Sale Price | Title Company |
|---|---|---|---|
| Kreutz Kirsten E | -- | Old Republic Title | |
| Gregston Jillian J | $146,500 | Stephens Co Abstract Co | |
| Churchman Brian | $57,000 | -- | |
| -- | $6,000 | -- |
Source: Public Records
Mortgage History
| Date | Status | Borrower | Loan Amount |
|---|---|---|---|
| Open | Kreutz Kirsten E | $162,000 | |
| Previous Owner | Gregston Jillian J | $143,993 |
Source: Public Records
Tax History Compared to Growth
Tax History
| Year | Tax Paid | Tax Assessment Tax Assessment Total Assessment is a certain percentage of the fair market value that is determined by local assessors to be the total taxable value of land and additions on the property. | Land | Improvement |
|---|---|---|---|---|
| 2025 | $1,733 | $20,009 | $1,365 | $18,644 |
| 2024 | $1,733 | $20,248 | $1,365 | $18,883 |
| 2023 | $1,397 | $16,318 | $1,365 | $14,953 |
| 2022 | $1,300 | $16,286 | $1,365 | $14,921 |
| 2021 | $1,056 | $13,403 | $1,365 | $12,038 |
| 2020 | $1,101 | $13,756 | $1,365 | $12,391 |
| 2019 | $1,069 | $13,355 | $1,365 | $11,990 |
| 2018 | $1,115 | $13,525 | $1,365 | $12,160 |
| 2017 | $1,048 | $13,594 | $1,364 | $12,230 |
| 2016 | $1,004 | $12,814 | $1,360 | $11,454 |
| 2015 | $935 | $12,440 | $1,349 | $11,091 |
| 2014 | $935 | $12,078 | $1,339 | $10,739 |
Source: Public Records
Map
Nearby Homes
- 1244 Carriage Dr
- 1359 Smith Rd
- 1385 Smith Rd
- 0 W Beech Ave
- 210 210 N 31st St
- 206 N 28th St
- 507 N Alice Dr
- 2150 Drexal Place
- 2210 Western Dr
- 2230 W Spruce St
- 106 Emery Rd
- 3421 Salter St
- 2149 2149 Patty Ln
- 2206 2206 W Spruce
- 201 N 23rd St
- 209 N 22nd St
- 210 N 22nd St
- 2204 W Parkview Ave
- 2108 Ave
- 2011 2011 W Oak Ave
- 2941 Nola Ct
- 2909 Nola Ct
- 1276 Carriage Dr
- 2914 Nola Ct
- 618 Carriage Dr
- 626 Carriage Dr
- 1244 1244 Carriage Dr
- 2905 Nola Ct
- 701 Sunnylane St
- 614 Carriage Dr
- 702 Carriage Dr
- 2910 Nola Ct
- 705 Sunnylane St
- 1234 1234 Carriage
- 2936 Nola Ct
- 2906 Nola Ct
- 610 Carriage Dr
- 2901 Nola Ct
- 2915 Nola Ct
- 1330 Sunnylane St