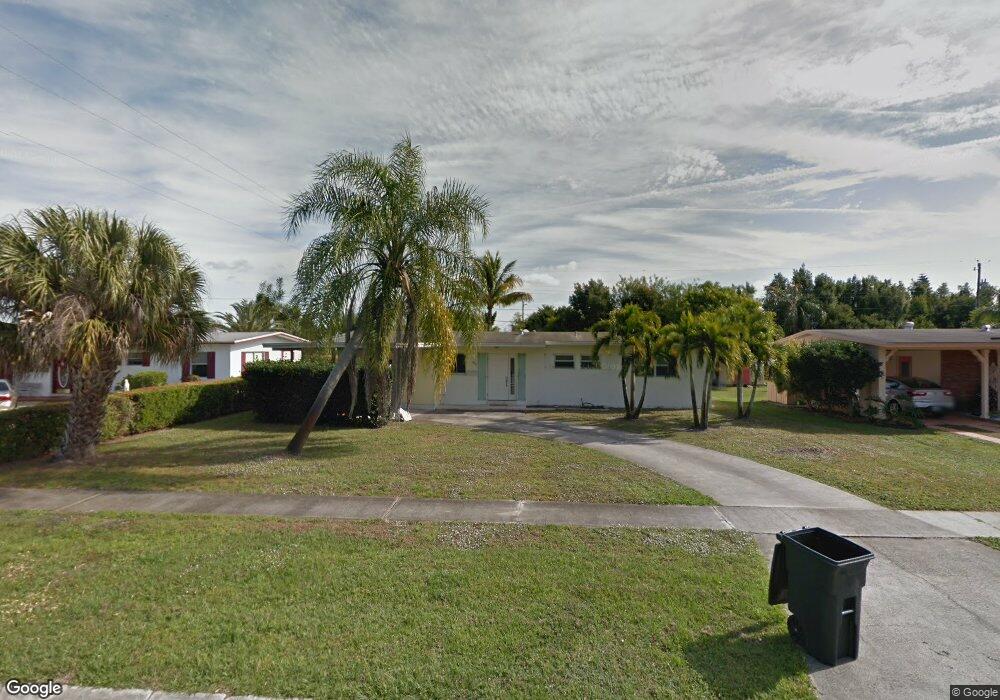
2913 SE Pruitt Rd Port Saint Lucie, FL 34952
Sandpiper Bay NeighborhoodEstimated Value: $276,570 - $324,000
3
Beds
2
Baths
1,272
Sq Ft
$236/Sq Ft
Est. Value
About This Home
This home is located at 2913 SE Pruitt Rd, Port Saint Lucie, FL 34952 and is currently estimated at $300,393, approximately $236 per square foot. 2913 SE Pruitt Rd is a home located in St. Lucie County with nearby schools including Morningside Elementary School, Mariposa Elementary School, and Floresta Elementary School.
Ownership History
Date
Name
Owned For
Owner Type
Purchase Details
Closed on
Sep 15, 2021
Sold by
Grow Bryan
Bought by
Grow Bryan
Current Estimated Value
Home Financials for this Owner
Home Financials are based on the most recent Mortgage that was taken out on this home.
Original Mortgage
$101,100
Outstanding Balance
$91,591
Interest Rate
2.8%
Mortgage Type
New Conventional
Estimated Equity
$208,802
Purchase Details
Closed on
Feb 25, 2013
Sold by
Grow Jennifer M and Grow Bryan
Bought by
Grow Bryan
Purchase Details
Closed on
Aug 14, 2009
Sold by
Grow Bryan and Grow Jennifer M
Bought by
Grow Bryan and Grow Jennifer M
Purchase Details
Closed on
Jun 27, 2008
Sold by
Obrien Douglas A and Obrien Karen
Bought by
Grow Bryan and Newell Jennifer
Home Financials for this Owner
Home Financials are based on the most recent Mortgage that was taken out on this home.
Original Mortgage
$120,051
Interest Rate
6.08%
Mortgage Type
FHA
Purchase Details
Closed on
Dec 16, 2002
Sold by
Keenan Ruth M
Bought by
Obrien Douglas A and Obrien Karen
Create a Home Valuation Report for This Property
The Home Valuation Report is an in-depth analysis detailing your home's value as well as a comparison with similar homes in the area
Home Values in the Area
Average Home Value in this Area
Purchase History
| Date | Buyer | Sale Price | Title Company |
|---|---|---|---|
| Grow Bryan | -- | Attorney | |
| Grow Bryan | -- | Attorney | |
| Grow Bryan | -- | Attorney | |
| Grow Bryan | $121,000 | Attorney | |
| Obrien Douglas A | $73,000 | -- |
Source: Public Records
Mortgage History
| Date | Status | Borrower | Loan Amount |
|---|---|---|---|
| Open | Grow Bryan | $101,100 | |
| Closed | Grow Bryan | $120,051 |
Source: Public Records
Tax History Compared to Growth
Tax History
| Year | Tax Paid | Tax Assessment Tax Assessment Total Assessment is a certain percentage of the fair market value that is determined by local assessors to be the total taxable value of land and additions on the property. | Land | Improvement |
|---|---|---|---|---|
| 2025 | $1,337 | $71,607 | -- | -- |
| 2024 | $1,318 | $69,589 | -- | -- |
| 2023 | $1,318 | $67,563 | $0 | $0 |
| 2022 | $1,250 | $65,596 | $0 | $0 |
| 2021 | $1,171 | $63,686 | $0 | $0 |
| 2020 | $1,178 | $62,807 | $0 | $0 |
| 2019 | $1,182 | $61,395 | $0 | $0 |
| 2018 | $1,139 | $60,251 | $0 | $0 |
| 2017 | $1,142 | $91,600 | $40,500 | $51,100 |
| 2016 | $1,140 | $79,500 | $32,400 | $47,100 |
| 2015 | $1,148 | $62,900 | $24,600 | $38,300 |
| 2014 | $1,111 | $56,942 | $0 | $0 |
Source: Public Records
Map
Nearby Homes
- 308 SE Via Sangro
- 312 SE Via Sangro
- 320 SE Via Sangro
- 344 SE Via Sangro
- 228 SE Via Sangro
- 233 SE Via Sangro
- 212 SE Via Sangro
- 391 SE Via Sangro
- 3056 SE Morningside Blvd
- 204 SE Via Sangro
- 213 SE Via Sangro
- 403 SE Via Sangro
- 339 SE Via Sangro
- 336 SE Via Sangro
- 203 SE Via Sangro
- 419 SE Via Sangro
- 187 SE Via Sangro
- 423 SE Via Sangro
- 152 SE Via Tirso
- 3100 SE Pruitt Rd Unit 105
- 2923 SE Pruitt Rd
- 2903 SE Pruitt Rd
- 2924 SE Morningside Blvd
- 1106 SE Mayfair Ln
- 2933 SE Pruitt Rd
- 1102 SE Mayfair Ln
- 304 SE Via Sangro
- 296 SE Via Sangro
- 2912 SE Morningside Blvd
- 2943 SE Pruitt Rd
- 2936 SE Morningside Blvd
- 316 SE Via Sangro
- 1114 SE Mayfair Ln
- 1101 SE Mayfair Ln
- 1103 SE Mayfair Ln
- 2948 SE Morningside Blvd
- 324 SE Via Sangro
- 1111 SE Mayfair Ln
- 284 SE Via Sangro
- 2921 SE Morningside Blvd