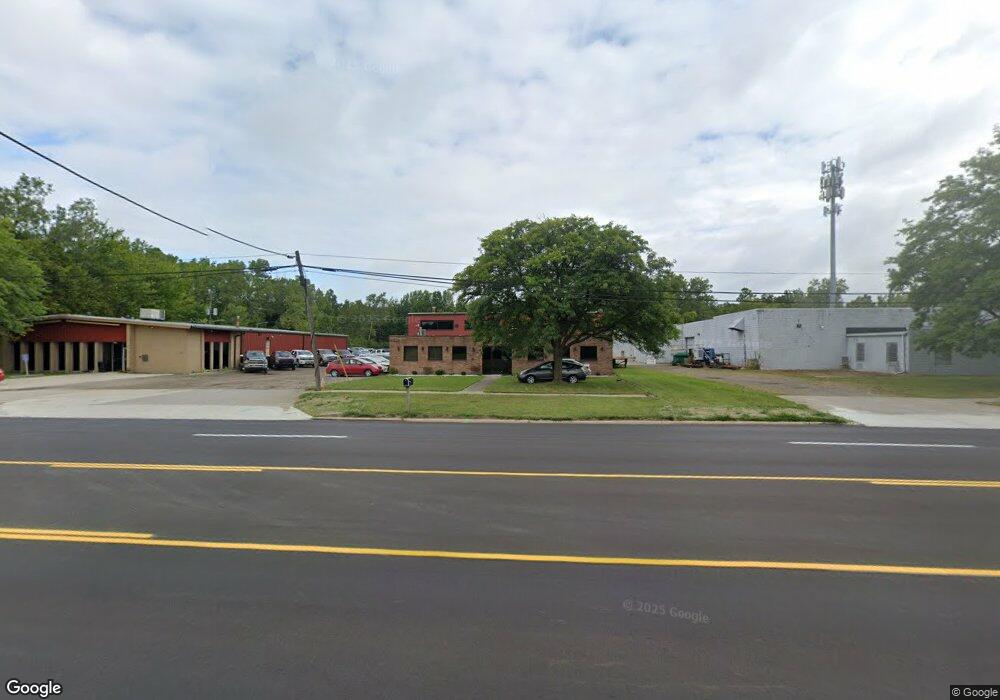
29130 Northline Rd Romulus, MI 48174
Estimated Value: $537,877
Studio
--
Bath
6,000
Sq Ft
$90/Sq Ft
Est. Value
About This Home
This home is located at 29130 Northline Rd, Romulus, MI 48174 and is currently estimated at $537,877, approximately $89 per square foot. 29130 Northline Rd is a home located in Wayne County with nearby schools including Halecreek Elementary School, Romulus Middle School, and Romulus Senior High School.
Ownership History
Date
Name
Owned For
Owner Type
Purchase Details
Closed on
Apr 26, 2021
Sold by
Detroit Shuttle Express
Bought by
Startle Llc
Current Estimated Value
Home Financials for this Owner
Home Financials are based on the most recent Mortgage that was taken out on this home.
Original Mortgage
$312,000
Outstanding Balance
$282,308
Interest Rate
3%
Mortgage Type
Future Advance Clause Open End Mortgage
Estimated Equity
$255,569
Purchase Details
Closed on
Jan 8, 2015
Sold by
Sarnecky John T and Sarnecky Marissa
Bought by
Detroit Shuttle Express Inc
Purchase Details
Closed on
Nov 28, 2013
Sold by
Elrod Michael Gene and Elrod Lisa
Bought by
Sarnecky John T and Sarnecky Marissa
Purchase Details
Closed on
May 8, 2013
Sold by
Sarnecky John T and Sarnecky Marissa
Bought by
Elrod Michael Gene
Purchase Details
Closed on
Oct 22, 2007
Sold by
Wojtowicz Raymond J
Bought by
Sarnecky Ii John T
Create a Home Valuation Report for This Property
The Home Valuation Report is an in-depth analysis detailing your home's value as well as a comparison with similar homes in the area
Home Values in the Area
Average Home Value in this Area
Purchase History
| Date | Buyer | Sale Price | Title Company |
|---|---|---|---|
| Startle Llc | $390,000 | Fidelity National Title | |
| Detroit Shuttle Express Inc | -- | Fidelity National Title | |
| Sarnecky John T | -- | None Available | |
| Elrod Michael Gene | -- | Fidelity National Title | |
| Sarnecky Ii John T | $200,000 | None Available |
Source: Public Records
Mortgage History
| Date | Status | Borrower | Loan Amount |
|---|---|---|---|
| Open | Startle Llc | $312,000 |
Source: Public Records
Tax History
| Year | Tax Paid | Tax Assessment Tax Assessment Total Assessment is a certain percentage of the fair market value that is determined by local assessors to be the total taxable value of land and additions on the property. | Land | Improvement |
|---|---|---|---|---|
| 2025 | $7,675 | $137,000 | $0 | $0 |
| 2024 | $7,615 | $129,500 | $0 | $0 |
| 2023 | $0 | $124,900 | $0 | $0 |
| 2022 | $1,222 | $116,500 | $0 | $0 |
| 2021 | $4,263 | $77,800 | $0 | $0 |
| 2020 | $4,173 | $74,600 | $0 | $0 |
| 2019 | $4,124 | $72,400 | $0 | $0 |
| 2018 | $2,974 | $66,000 | $0 | $0 |
| 2017 | $3,473 | $66,000 | $0 | $0 |
| 2016 | $3,668 | $56,600 | $0 | $0 |
| 2015 | $5,669 | $57,100 | $0 | $0 |
| 2013 | $6,040 | $60,400 | $0 | $0 |
| 2012 | $2,619 | $73,000 | $9,200 | $63,800 |
Source: Public Records
Map
Nearby Homes
- 11398 Harrison
- 12000 Inkster Rd
- 20820 Inkster Rd
- 00 Eureka Rd
- 28109 Goddard Rd
- 14611 New York St
- Lot 106 Hollywood
- Lot 107 Hollywood
- 00000 Huron
- 0 Hannan-Huro River Dr Unit 20261004710
- 16295 Vining Rd
- 0 Telegraph Rd Unit 20221042429
- Lot 105 Hollywood
- 15350 Woodmont St
- 0 Merriman Unit 50172343
- OOOOO Grant Wahrman
- VAC Wayne
- 00000 Northline Rd
- 15654 Isabelle St
- 29934 Spain St
- 29130 Northline Rd
- 29100 Northline Rd
- 29160 Northline Rd
- 29050 Northline Rd
- 29075 Northline Rd
- 29037 Northline Rd
- 29231 Northline Rd
- 28795 Northline Rd
- 28750 Northline Rd
- 28775 Northline Rd
- 29349 Northline Rd
- 13060 Homefield St
- 13080 Homefield St
- 28721 Northline Rd
- 13100 Homefield St
- 13100 Homefield St
- 28713 Northline Rd
- 13071 Homefield St
- 28705 Northline Rd
- 13093 Homefield St
Your Personal Tour Guide
Ask me questions while you tour the home.