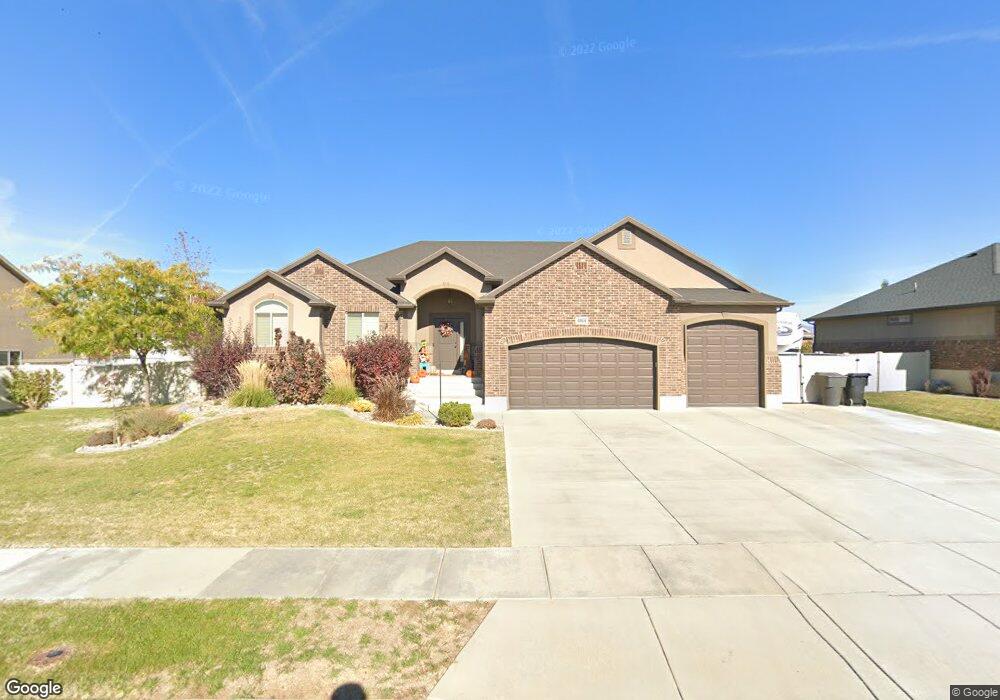
2914 W 960 N Clearfield, UT 84015
Estimated Value: $556,000 - $604,000
3
Beds
2
Baths
1,587
Sq Ft
$371/Sq Ft
Est. Value
About This Home
This home is located at 2914 W 960 N, Clearfield, UT 84015 and is currently estimated at $589,429, approximately $371 per square foot. 2914 W 960 N is a home with nearby schools including Lakeside School, West Point Junior High School, and Syracuse High School.
Ownership History
Date
Name
Owned For
Owner Type
Purchase Details
Closed on
Oct 28, 2011
Sold by
Castle Creek Homes Llc
Bought by
Woolf Brandon R and Woolf Wendy K
Current Estimated Value
Home Financials for this Owner
Home Financials are based on the most recent Mortgage that was taken out on this home.
Original Mortgage
$257,771
Outstanding Balance
$172,815
Interest Rate
3.75%
Mortgage Type
FHA
Estimated Equity
$416,614
Purchase Details
Closed on
May 26, 2011
Sold by
Castle Creek Homes Llc
Bought by
Woolf Brandon R and Woolf Wendy K
Home Financials for this Owner
Home Financials are based on the most recent Mortgage that was taken out on this home.
Original Mortgage
$257,450
Interest Rate
10%
Mortgage Type
Unknown
Purchase Details
Closed on
Apr 25, 2011
Sold by
New Hampton Manor Associates
Bought by
Castlecreek Homes Llc
Home Financials for this Owner
Home Financials are based on the most recent Mortgage that was taken out on this home.
Original Mortgage
$257,450
Interest Rate
10%
Mortgage Type
Unknown
Create a Home Valuation Report for This Property
The Home Valuation Report is an in-depth analysis detailing your home's value as well as a comparison with similar homes in the area
Home Values in the Area
Average Home Value in this Area
Purchase History
| Date | Buyer | Sale Price | Title Company |
|---|---|---|---|
| Woolf Brandon R | -- | Mountain View Title | |
| Woolf Brandon R | -- | Mountain View Title | |
| Castlecreek Homes Llc | -- | Bonneville Superior |
Source: Public Records
Mortgage History
| Date | Status | Borrower | Loan Amount |
|---|---|---|---|
| Open | Woolf Brandon R | $257,771 | |
| Previous Owner | Woolf Brandon R | $257,450 | |
| Previous Owner | Woolf Brandon R | $191,306 |
Source: Public Records
Tax History Compared to Growth
Tax History
| Year | Tax Paid | Tax Assessment Tax Assessment Total Assessment is a certain percentage of the fair market value that is determined by local assessors to be the total taxable value of land and additions on the property. | Land | Improvement |
|---|---|---|---|---|
| 2025 | $3,072 | $295,350 | $106,884 | $188,466 |
| 2024 | $2,942 | $284,349 | $115,652 | $168,697 |
| 2023 | $2,784 | $273,900 | $74,146 | $199,753 |
| 2022 | $2,969 | $534,000 | $142,845 | $391,155 |
| 2021 | $2,787 | $409,000 | $105,006 | $303,994 |
| 2020 | $2,534 | $368,000 | $92,940 | $275,060 |
| 2019 | $2,467 | $350,000 | $101,802 | $248,198 |
| 2018 | $2,317 | $323,000 | $85,131 | $237,869 |
| 2016 | $2,284 | $164,450 | $32,396 | $132,054 |
| 2015 | $2,328 | $159,335 | $32,396 | $126,939 |
| 2014 | $2,090 | $145,290 | $32,396 | $112,894 |
| 2013 | -- | $144,650 | $31,860 | $112,790 |
Source: Public Records
Map
Nearby Homes