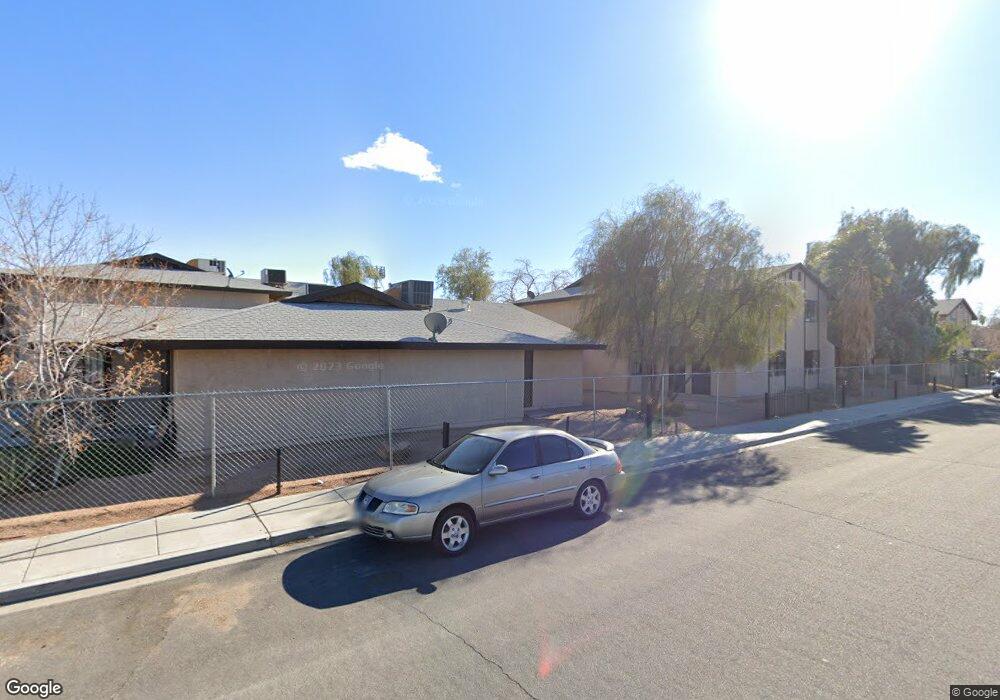
2915 Cedar Ave Unit 16D Las Vegas, NV 89101
East Las Vegas NeighborhoodEstimated Value: $149,000 - $169,652
2
Beds
2
Baths
1,021
Sq Ft
$159/Sq Ft
Est. Value
About This Home
This home is located at 2915 Cedar Ave Unit 16D, Las Vegas, NV 89101 and is currently estimated at $162,217, approximately $158 per square foot. 2915 Cedar Ave Unit 16D is a home located in Clark County with nearby schools including Arturo Cambeiro Elementary School, J.D. Smith Middle School, and Desert Pines High School.
Ownership History
Date
Name
Owned For
Owner Type
Purchase Details
Closed on
Nov 8, 2010
Sold by
Fannie Mae
Bought by
Taquiqui Domingo and Taquiqui Lourdes
Current Estimated Value
Purchase Details
Closed on
Aug 16, 2010
Sold by
Soriano Jose L
Bought by
Fannie Mae and Federal National Mortgage Association
Purchase Details
Closed on
Sep 9, 2004
Sold by
Hernandez Renato Delgadillo
Bought by
Soriano Jose L
Home Financials for this Owner
Home Financials are based on the most recent Mortgage that was taken out on this home.
Original Mortgage
$71,000
Interest Rate
5.8%
Mortgage Type
Unknown
Purchase Details
Closed on
Jul 19, 2000
Sold by
Plonski Marta K
Bought by
Hernandez Renato Delgadillo
Home Financials for this Owner
Home Financials are based on the most recent Mortgage that was taken out on this home.
Original Mortgage
$50,492
Interest Rate
8.07%
Mortgage Type
FHA
Create a Home Valuation Report for This Property
The Home Valuation Report is an in-depth analysis detailing your home's value as well as a comparison with similar homes in the area
Home Values in the Area
Average Home Value in this Area
Purchase History
| Date | Buyer | Sale Price | Title Company |
|---|---|---|---|
| Taquiqui Domingo | $23,500 | Old Republic Title Company | |
| Fannie Mae | $58,233 | None Available | |
| Soriano Jose L | $71,000 | Lawyers Title Of Nevada | |
| Hernandez Renato Delgadillo | $51,990 | Stewart Title |
Source: Public Records
Mortgage History
| Date | Status | Borrower | Loan Amount |
|---|---|---|---|
| Previous Owner | Soriano Jose L | $71,000 | |
| Previous Owner | Hernandez Renato Delgadillo | $50,492 |
Source: Public Records
Tax History Compared to Growth
Tax History
| Year | Tax Paid | Tax Assessment Tax Assessment Total Assessment is a certain percentage of the fair market value that is determined by local assessors to be the total taxable value of land and additions on the property. | Land | Improvement |
|---|---|---|---|---|
| 2025 | $385 | $30,823 | $9,100 | $21,723 |
| 2024 | $374 | $30,823 | $9,100 | $21,723 |
| 2023 | $374 | $34,427 | $14,350 | $20,077 |
| 2022 | $364 | $29,780 | $10,500 | $19,280 |
| 2021 | $353 | $22,724 | $7,000 | $15,724 |
| 2020 | $340 | $21,905 | $5,250 | $16,655 |
| 2019 | $330 | $20,497 | $3,850 | $16,647 |
| 2018 | $320 | $19,878 | $3,850 | $16,028 |
| 2017 | $985 | $30,042 | $3,500 | $26,542 |
| 2016 | $305 | $20,604 | $2,625 | $17,979 |
| 2015 | $303 | $15,719 | $2,100 | $13,619 |
| 2014 | $294 | $8,873 | $1,750 | $7,123 |
Source: Public Records
Map
Nearby Homes
- 2915 Cedar Ave Unit 11C
- 506 Wardelle St Unit C
- 2812 Marlin Ave
- 520 N 28th St
- 2645 Cedar Ave
- 2516 E Mesquite Ave
- 2513 Cedar Ave
- 2600 E Bonanza Rd
- 0 Mcknight St
- 2218 E Mesquite Ave
- 920 E Bonanza Rd
- 802 Stewart Ave
- 2408 Berkley Ave
- 2528 Sunrise Ave
- 50 N 27th St
- 921 Delta St
- 2538 Valley St
- 2016 Linden Ave
- 2020 E Bonanza Rd
- 209 N 21st St
- 2915 Cedar Ave Unit 3B
- 2915 Cedar Ave Unit 3A
- 2915 Cedar Ave Unit 7B
- 2915 Cedar Ave Unit 4A
- 2915 Cedar Ave Unit 9C
- 2915 Cedar Ave Unit 10C
- 2915 Cedar Ave Unit 15D
- 2915 Cedar Ave Unit 13D
- 2915 Cedar Ave Unit 6B
- 2915 Cedar Ave Unit 1A
- 2915 Cedar Ave Unit 5B
- 2915 Cedar Ave Unit 8B
- 2915 Cedar Ave Unit 14D
- 2915 Cedar Ave Unit 2A
- 2915 Cedar Ave Unit 2C
- 2915 Cedar Ave Unit 2D
- 2915 Cedar Ave Unit 2B
- 2915 Cedar Ave Unit 3C
- 2915 Cedar Ave Unit 1c
- 2915 Cedar Ave Unit C2