
Landlord's Agent in 2014
Melanie Hutchinson
Chapman Hall Realtors
(404) 229-0988
6 in this area
20 Total Sales
Estimated Value: $470,000 - $586,000
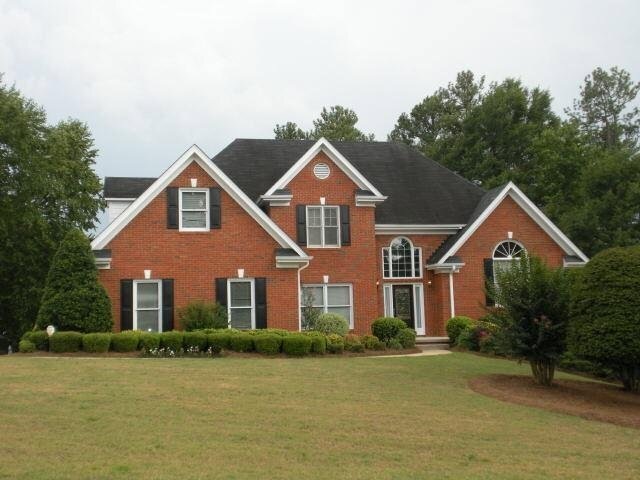
Huge, three-sided brick tradition located in an upscale swim, tennis and lake community. Beautifully appointed with hardwood floors, cathedral and trey ceilings, master on the main level, two-story foyer and great room. First month's rent, plus security deposit with good rental history. No pets please.
Last Agent to Rent the Property
Chapman Hall Realtors License #261913 Listed on: 09/01/2013
| Date | Event | Price | List to Sale | Price per Sq Ft |
|---|---|---|---|---|
| 03/01/2014 03/01/14 | Rented | $1,895 | 0.0% | -- |
| 01/30/2014 01/30/14 | Under Contract | -- | -- | -- |
| 09/01/2013 09/01/13 | For Rent | $1,895 | -2.8% | -- |
| 07/04/2012 07/04/12 | For Rent | $1,950 | +2.9% | -- |
| 07/04/2012 07/04/12 | Rented | $1,895 | -- | -- |
| Year | Tax Paid | Tax Assessment Tax Assessment Total Assessment is a certain percentage of the fair market value that is determined by local assessors to be the total taxable value of land and additions on the property. | Land | Improvement |
|---|---|---|---|---|
| 2024 | $8,431 | $214,440 | $34,720 | $179,720 |
| 2023 | $8,244 | $204,320 | $34,720 | $169,600 |
| 2022 | $6,822 | $168,480 | $21,640 | $146,840 |
| 2021 | $5,714 | $141,880 | $21,640 | $120,240 |
| 2020 | $6,173 | $144,360 | $21,800 | $122,560 |
| 2019 | $5,388 | $119,560 | $13,200 | $106,360 |
| 2018 | $5,412 | $119,560 | $13,200 | $106,360 |
| 2017 | $5,005 | $109,520 | $13,200 | $96,320 |
| 2016 | $3,984 | $87,080 | $13,200 | $73,880 |
| 2015 | $3,837 | $83,760 | $13,200 | $70,560 |
| 2014 | $3,755 | $81,120 | $10,560 | $70,560 |
| 2013 | -- | $104,120 | $13,560 | $90,560 |
Landlord's Agent in 2014
Melanie Hutchinson
Chapman Hall Realtors
(404) 229-0988
6 in this area
20 Total Sales
Tenant's Agent in 2014
Glenda Broker
Non-Mls Company
(800) 289-1214
Source: Georgia MLS
MLS Number: 7149999
APN: 079-D-01-0110
Disclaimer: Certain information contained herein is derived from information provided by parties other than Homes.com. All information provided is deemed reliable, but is not guaranteed to be accurate and should be independently verified.
![]() The data relating to real estate for sale on this web site comes in part from the Broker Reciprocity Program of Georgia MLS. Real estate listings held by brokerage firms other than Redfin are marked with the Broker Reciprocity logo and detailed information about them includes the name of the listing brokers. Information deemed reliable but not guaranteed. Copyright 2025 Georgia MLS. All rights reserved.
The data relating to real estate for sale on this web site comes in part from the Broker Reciprocity Program of Georgia MLS. Real estate listings held by brokerage firms other than Redfin are marked with the Broker Reciprocity logo and detailed information about them includes the name of the listing brokers. Information deemed reliable but not guaranteed. Copyright 2025 Georgia MLS. All rights reserved.