2915 Juice Plant Rd Marshallville, GA 31057
Estimated Value: $383,000 - $973,571
--
Bed
1
Bath
2,192
Sq Ft
$309/Sq Ft
Est. Value
About This Home
This home is located at 2915 Juice Plant Rd, Marshallville, GA 31057 and is currently estimated at $678,286, approximately $309 per square foot. 2915 Juice Plant Rd is a home with nearby schools including Macon County Elementary School, Macon County Middle School, and Macon County High School.
Ownership History
Date
Name
Owned For
Owner Type
Purchase Details
Closed on
Dec 31, 2023
Sold by
Few Murph Ignatius
Bought by
Barfield Amanda Murph and Murph Ignatius Few
Current Estimated Value
Purchase Details
Closed on
May 7, 2014
Sold by
Murph Phillip F
Bought by
Murph I F
Purchase Details
Closed on
Jan 5, 2004
Sold by
Murph Ii Burke B
Bought by
Murph Phillip F
Purchase Details
Closed on
Dec 25, 2003
Sold by
Murph Ii Burke B
Bought by
Murph Phillip F
Purchase Details
Closed on
May 6, 2003
Sold by
Schiebert David
Bought by
Murph Phillip F
Purchase Details
Closed on
Dec 31, 2002
Sold by
Schiebert David
Bought by
Murph Phillip F
Purchase Details
Closed on
Jan 25, 1994
Sold by
Murph I F Iii Burke
Bought by
Murph I F
Purchase Details
Closed on
Sep 18, 1986
Sold by
Murph I F
Bought by
Murph I F Iii Burke
Purchase Details
Closed on
Jan 1, 1961
Bought by
Murph I F
Create a Home Valuation Report for This Property
The Home Valuation Report is an in-depth analysis detailing your home's value as well as a comparison with similar homes in the area
Home Values in the Area
Average Home Value in this Area
Purchase History
| Date | Buyer | Sale Price | Title Company |
|---|---|---|---|
| Barfield Amanda Murph | -- | -- | |
| Murph I F | -- | -- | |
| Murph Phillip F | -- | -- | |
| Murph Phillip F | -- | -- | |
| Murph Phillip F | -- | -- | |
| Murph Phillip F | -- | -- | |
| Murph I F | -- | -- | |
| Murph I F Iii Burke | -- | -- | |
| Murph I F | -- | -- |
Source: Public Records
Tax History Compared to Growth
Tax History
| Year | Tax Paid | Tax Assessment Tax Assessment Total Assessment is a certain percentage of the fair market value that is determined by local assessors to be the total taxable value of land and additions on the property. | Land | Improvement |
|---|---|---|---|---|
| 2024 | $5,030 | $283,376 | $195,237 | $88,139 |
| 2023 | $5,096 | $290,321 | $195,237 | $95,084 |
| 2022 | $4,300 | $264,396 | $195,237 | $69,159 |
| 2021 | $4,702 | $162,247 | $122,889 | $39,358 |
| 2020 | $3,426 | $162,247 | $122,889 | $39,358 |
| 2019 | $4,702 | $162,247 | $122,889 | $39,358 |
| 2018 | $3,307 | $162,247 | $122,889 | $39,358 |
| 2017 | $3,269 | $162,247 | $122,889 | $39,358 |
| 2016 | $3,210 | $162,247 | $122,889 | $39,358 |
| 2015 | -- | $43,130 | $523 | $42,608 |
| 2014 | -- | $43,130 | $523 | $42,608 |
| 2013 | -- | $165,496 | $122,888 | $42,607 |
Source: Public Records
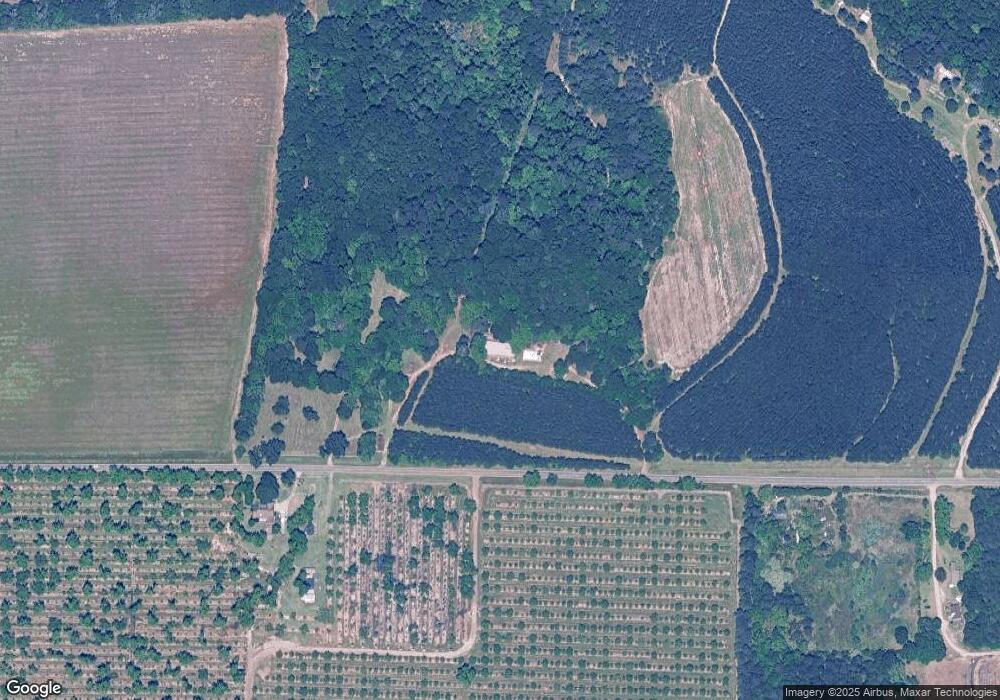
Map
Nearby Homes
- 0 Willow Creek Dr Unit 7664473
- 0 Willow Creek Dr Unit 10623466
- 000 Willow Lake Rd
- 34 Rosewood Dr
- 191 Daniel Dr
- 429 Main St E
- 65 Mathews St
- 2249 Georgia 49
- 0 Ira Hicks Blvd
- 206 Willow Lake Rd
- 905 Carver Dr
- 320 Old Perry Rd
- 407 Emory St
- 138 N Jones St
- 408 Spillers St
- 200 Lavender St
- 47 King St
- 1167 Clopine Lake Rd
- 225 Lily St
- 209 Spillers St
- 3303 Juice Plant Rd
- 2840 Camp John Hope Rd
- 3188 Juice Plant Rd
- 3507 Juice Plant Rd
- 2700 Camp John Hope Rd
- 2652 Camp John Hope Rd
- 2554 Camp John Hope Rd
- 3174 Camp John Hope Rd
- 2753 Camp John Hope Rd
- 2827 Camp John Hope Rd
- 2705 Camp John Hope Rd
- 110 Finch Ln
- 2615 Camp John Hope Rd
- 2392 Camp John Hope Rd
- 2449 Camp John Hope Rd
- 3530 Juice Plant Rd
- 192 Finch Ln
- 2385 Camp John Hope Rd
- 1280 Barrow Rd
- 260 Finch Ln