2915 N Mango Ave Chicago, IL 60634
Belmont Central NeighborhoodEstimated Value: $366,000 - $424,000
About This Home
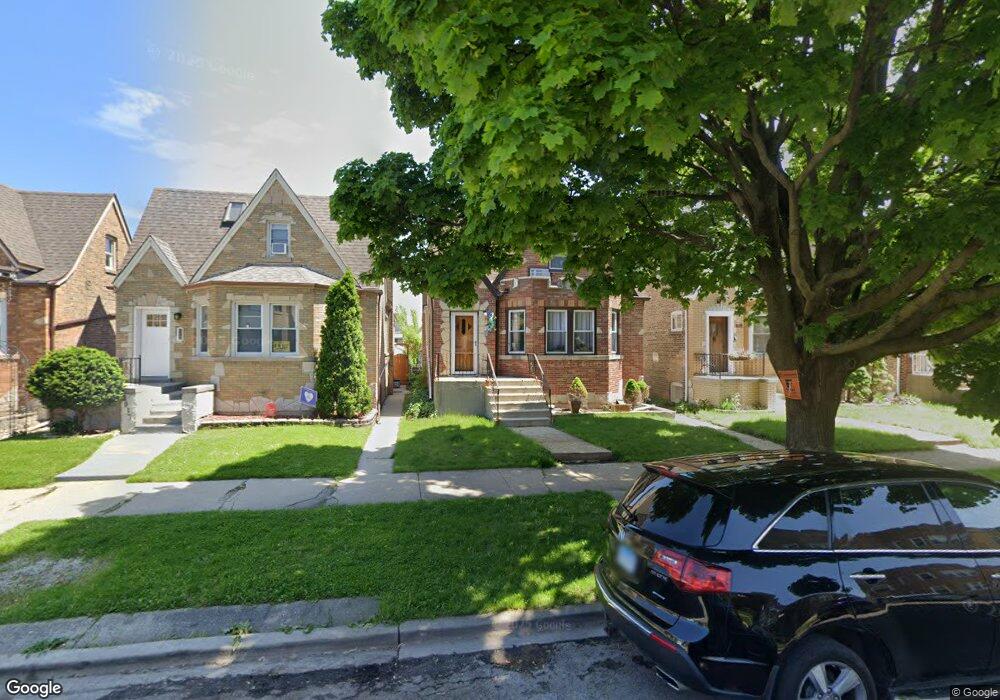
This home is located at 2915 N Mango Ave, Chicago, IL 60634 and is currently estimated at $399,014, approximately $353 per square foot. 2915 N Mango Ave is a home located in Cook County with nearby schools including Schubert Elementary School, Northwest Middle School, and Steinmetz College Prep.
Ownership History
We collect this data history from publicly available records. To have your information removed, we recommend requesting removal directly through your county’s website.
Purchase Details
Home Financials for this Owner
Home Financials are based on the most recent Mortgage that was taken out on this home.Purchase Details
Home Financials for this Owner
Home Financials are based on the most recent Mortgage that was taken out on this home.Purchase Details
Home Financials for this Owner
Home Financials are based on the most recent Mortgage that was taken out on this home.Home Values in the Area
Average Home Value in this Area
Purchase History
We collect this data history from publicly available records. To have your information removed, we recommend requesting removal directly through your county’s website.
| Date | Buyer | Sale Price | Title Company |
|---|---|---|---|
| $218,000 | Law Title | ||
| -- | Acqt | ||
| $82,000 | -- |
Mortgage History
We collect this data history from publicly available records. To have your information removed, we recommend requesting removal directly through your county’s website.
| Date | Status | Borrower | Loan Amount |
|---|---|---|---|
| Previous Owner | $199,633 | ||
| Previous Owner | $250,000 | ||
| Previous Owner | $98,400 |
Tax History
We collect this data history from publicly available records. To have your information removed, we recommend requesting removal directly through your county’s website.
| Year | Tax Paid | Tax Assessment Tax Assessment Total Assessment is a certain percentage of the fair market value that is determined by local assessors to be the total taxable value of land and additions on the property. | Land | Improvement |
|---|---|---|---|---|
| 2025 | $5,422 | $27,000 | $11,532 | $15,468 |
| 2024 | $5,422 | $27,000 | $11,532 | $15,468 |
| 2023 | $5,264 | $29,000 | $9,300 | $19,700 |
| 2022 | $5,264 | $29,000 | $9,300 | $19,700 |
| 2021 | $5,165 | $29,000 | $9,300 | $19,700 |
| 2020 | $3,672 | $19,575 | $4,650 | $14,925 |
| 2019 | $3,732 | $21,995 | $4,650 | $17,345 |
| 2018 | $3,668 | $21,995 | $4,650 | $17,345 |
| 2017 | $3,922 | $21,583 | $4,092 | $17,491 |
| 2016 | $3,825 | $21,583 | $4,092 | $17,491 |
| 2015 | $3,476 | $21,583 | $4,092 | $17,491 |
| 2014 | $3,628 | $22,106 | $3,720 | $18,386 |
| 2013 | $4,023 | $22,106 | $3,720 | $18,386 |
Map
- 3052 N Major Ave
- 2728 N Major Ave
- 2827 N Mason Ave
- 2705 N Monitor Ave
- 2711 N Marmora Ave
- 3130 N Monitor Ave
- 2955 N Lotus Ave
- 2748 N Austin Ave
- 5700 W Melrose St
- 3234 N Central Ave Unit 304
- 2619 N Mason Ave
- 5450 W Drummond Place
- 6014 W Fletcher St
- 5449 W Melrose St
- 5320 W Wolfram St
- 2825 N Moody Ave
- 5335 W Barry Ave
- 5349 W Fletcher St
- 5615 W Henderson St
- 5438 W Melrose St
- 2911 N Mango Ave
- 2919 N Mango Ave
- 2907 N Mango Ave
- 2923 N Mango Ave
- 2905 N Mango Ave
- 2925 N Mango Ave
- 2901 N Mango Ave
- 2912 N Major Ave
- 2916 N Major Ave
- 2910 N Major Ave
- 2929 N Mango Ave
- 2918 N Major Ave
- 2906 N Major Ave
- 5734 W George St Unit 1E
- 5734 W George St Unit 2W
- 5734 W George St Unit 2E
- 5734 W George St Unit 1W
- 5734 W George St Unit 2E
- 5734 W George St Unit 1E
- 5734 W George St Unit 2W
Ask me questions while you tour the home.