2915 Olive St Columbus, OH 43204
Westgate NeighborhoodEstimated Value: $162,000 - $225,000
3
Beds
1
Bath
1,638
Sq Ft
$121/Sq Ft
Est. Value
About This Home
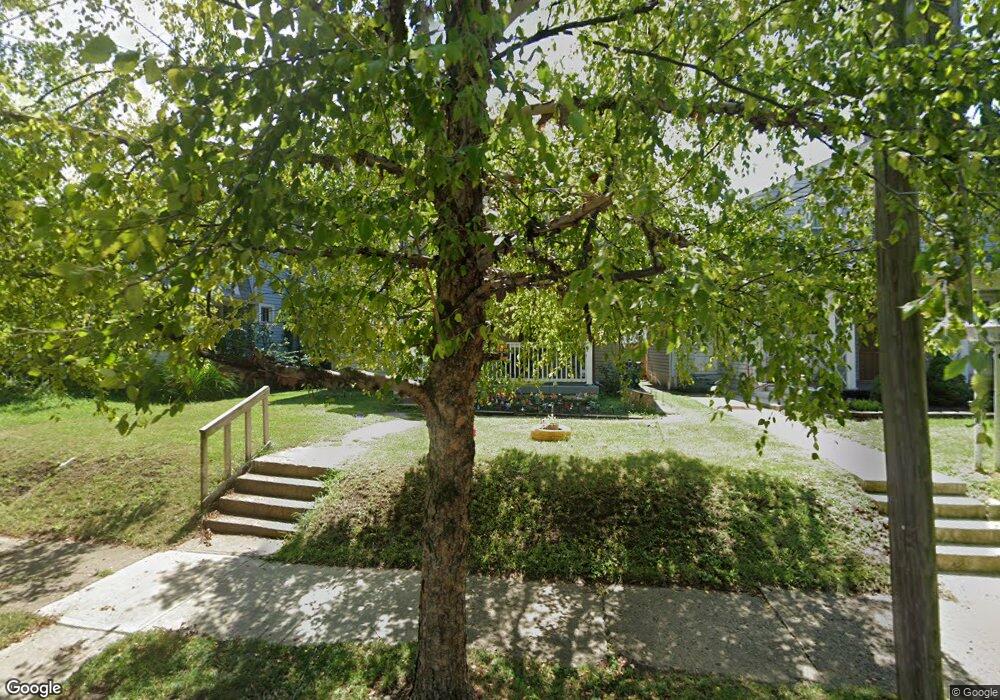
This home is located at 2915 Olive St, Columbus, OH 43204 and is currently estimated at $198,667, approximately $121 per square foot. 2915 Olive St is a home located in Franklin County with nearby schools including Westgate Alternative Elementary School, Westmoor Middle School, and West High School.
Ownership History
Date
Name
Owned For
Owner Type
Purchase Details
Closed on
Nov 9, 2020
Sold by
Nezarl Pat and The Glen Trust
Bought by
5009 Cherry Creek Llc
Current Estimated Value
Purchase Details
Closed on
Jan 21, 2005
Sold by
U S Bank Na
Bought by
Minoui Shahrokh
Purchase Details
Closed on
Sep 28, 2004
Sold by
Gray Terry J and Case #03Cve06 6211
Bought by
U S Bank Na
Purchase Details
Closed on
Nov 1, 1976
Bought by
Gray Terry J
Create a Home Valuation Report for This Property
The Home Valuation Report is an in-depth analysis detailing your home's value as well as a comparison with similar homes in the area
Home Values in the Area
Average Home Value in this Area
Purchase History
| Date | Buyer | Sale Price | Title Company |
|---|---|---|---|
| 5009 Cherry Creek Llc | -- | Bridge T&E Svcs Llc | |
| Minoui Shahrokh | $56,200 | Amerititle | |
| U S Bank Na | $80,000 | -- | |
| Gray Terry J | -- | -- |
Source: Public Records
Tax History
| Year | Tax Paid | Tax Assessment Tax Assessment Total Assessment is a certain percentage of the fair market value that is determined by local assessors to be the total taxable value of land and additions on the property. | Land | Improvement |
|---|---|---|---|---|
| 2025 | $1,930 | $42,110 | $18,200 | $23,910 |
| 2024 | $1,930 | $42,110 | $18,200 | $23,910 |
| 2023 | $1,906 | $42,110 | $18,200 | $23,910 |
| 2022 | $1,696 | $31,920 | $5,810 | $26,110 |
| 2021 | $1,699 | $31,920 | $5,810 | $26,110 |
| 2020 | $1,702 | $31,920 | $5,810 | $26,110 |
| 2019 | $1,655 | $26,610 | $4,870 | $21,740 |
| 2018 | $1,302 | $26,610 | $4,870 | $21,740 |
| 2017 | $1,704 | $26,610 | $4,870 | $21,740 |
| 2016 | $1,361 | $16,450 | $7,840 | $8,610 |
| 2015 | $1,017 | $16,450 | $7,840 | $8,610 |
| 2014 | $1,020 | $16,450 | $7,840 | $8,610 |
| 2013 | $503 | $16,450 | $7,840 | $8,610 |
Source: Public Records
Map
Nearby Homes
- 235 S Roys Ave
- 185 S Huron Ave
- 65 S Hague Ave
- 2845 Fremont St
- 327 S Chase Ave
- 2710 Palmetto St
- 363 S Chase Ave
- 144 S Brinker Ave
- 3096 Ellis Place
- 262 S Harris Ave
- 140 N Warren Ave
- 89 N Roys Ave
- 70 N Warren Ave
- 271 S Warren Ave
- 77 S Brinker Ave
- 75 N Huron Ave
- 107 Haldy Ave
- 51 S Ogden Ave Unit 51H
- 239 241 S Ogden Ave
- 338-340 S Harris Ave
Your Personal Tour Guide
Ask me questions while you tour the home.