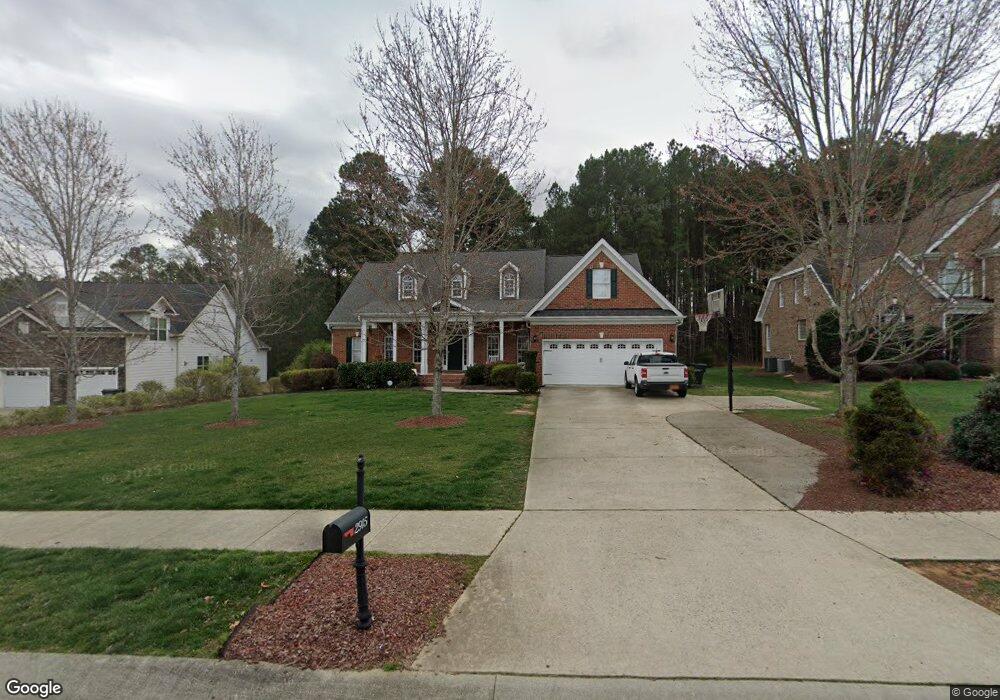
2915 Reynolda Cir Durham, NC 27712
Estimated Value: $664,000 - $731,000
4
Beds
4
Baths
3,086
Sq Ft
$226/Sq Ft
Est. Value
About This Home
This home is located at 2915 Reynolda Cir, Durham, NC 27712 and is currently estimated at $698,252, approximately $226 per square foot. 2915 Reynolda Cir is a home located in Durham County with nearby schools including Hillandale Elementary School, George L Carrington Middle, and Riverside High School.
Ownership History
Date
Name
Owned For
Owner Type
Purchase Details
Closed on
Oct 23, 2020
Sold by
Riggs Phillip G and Riggs Carol S
Bought by
Stewart Randall Halsey and Stewart Kimberly Crabtree
Current Estimated Value
Home Financials for this Owner
Home Financials are based on the most recent Mortgage that was taken out on this home.
Original Mortgage
$459,325
Outstanding Balance
$407,800
Interest Rate
2.8%
Mortgage Type
New Conventional
Estimated Equity
$290,452
Purchase Details
Closed on
Aug 28, 2008
Sold by
J M Kelly Construction Inc
Bought by
Riggs Phillip G and Riggs Carol S
Home Financials for this Owner
Home Financials are based on the most recent Mortgage that was taken out on this home.
Original Mortgage
$304,450
Interest Rate
6.21%
Mortgage Type
Purchase Money Mortgage
Create a Home Valuation Report for This Property
The Home Valuation Report is an in-depth analysis detailing your home's value as well as a comparison with similar homes in the area
Home Values in the Area
Average Home Value in this Area
Purchase History
| Date | Buyer | Sale Price | Title Company |
|---|---|---|---|
| Stewart Randall Halsey | $483,500 | None Available | |
| Riggs Phillip G | $398,000 | None Available |
Source: Public Records
Mortgage History
| Date | Status | Borrower | Loan Amount |
|---|---|---|---|
| Open | Stewart Randall Halsey | $459,325 | |
| Previous Owner | Riggs Phillip G | $304,450 |
Source: Public Records
Tax History Compared to Growth
Tax History
| Year | Tax Paid | Tax Assessment Tax Assessment Total Assessment is a certain percentage of the fair market value that is determined by local assessors to be the total taxable value of land and additions on the property. | Land | Improvement |
|---|---|---|---|---|
| 2025 | $5,610 | $676,363 | $134,100 | $542,263 |
| 2024 | $5,610 | $402,201 | $74,700 | $327,501 |
| 2023 | $5,268 | $402,201 | $74,700 | $327,501 |
| 2022 | $5,148 | $402,201 | $74,700 | $327,501 |
| 2021 | $5,039 | $395,535 | $74,700 | $320,835 |
| 2020 | $4,934 | $396,617 | $74,700 | $321,917 |
| 2019 | $4,934 | $396,617 | $74,700 | $321,917 |
| 2018 | $5,162 | $380,522 | $59,760 | $320,762 |
| 2017 | $5,124 | $380,522 | $59,760 | $320,762 |
| 2016 | $4,951 | $380,522 | $59,760 | $320,762 |
| 2015 | $5,603 | $404,732 | $100,637 | $304,095 |
| 2014 | $5,603 | $404,732 | $100,637 | $304,095 |
Source: Public Records
Map
Nearby Homes
- 2905 Reynolda Cir
- 4028 Chaucer Dr
- 3107 Rosebriar Dr
- 3047 Rosewood Cir
- 3228 Rose of Sharon Rd
- 16 Daly Ct
- 1409 Nicklaus Dr
- 4908 Mandel Rd
- 2009 Eden Shire Way
- 1139 Sawmill Ln
- 1143 Sawmill Ln
- 3015 Elk Ridge Rd
- 1821 Hideaway Ln
- 20 Indigo Creek Trail
- 1 Signet Dr Unit A17
- 1813 Grady Dr
- 3775 Guess Rd Unit 43
- 1027 Laurelwood Dr
- 1433 Cherrycrest Dr
- 5026 Gatewood Dr
- 2913 Reynolda Cir
- 2917 Reynolda Cir
- 2911 Reynolda Cir
- 2919 Reynolda Cir
- 2914 Reynolda Cir
- 2909 Reynolda Cir
- 4205 Guess Rd
- 2918 Reynolda Cir
- 4213 Guess Rd
- 2907 Reynolda Cir
- 2907 Reynolda Cir Unit 40
- 2906 Reynolda Cir
- 2802 Reynolda Cir
- 3306 Golden Heather Dr
- 2921 Reynolda Cir
- 2804 Reynolda Cir
- 3502 Golden Heather Dr
- 3304 Golden Heather Dr
- 2905 Reynolda Cir Unit 41
- 2904 Reynolda Cir