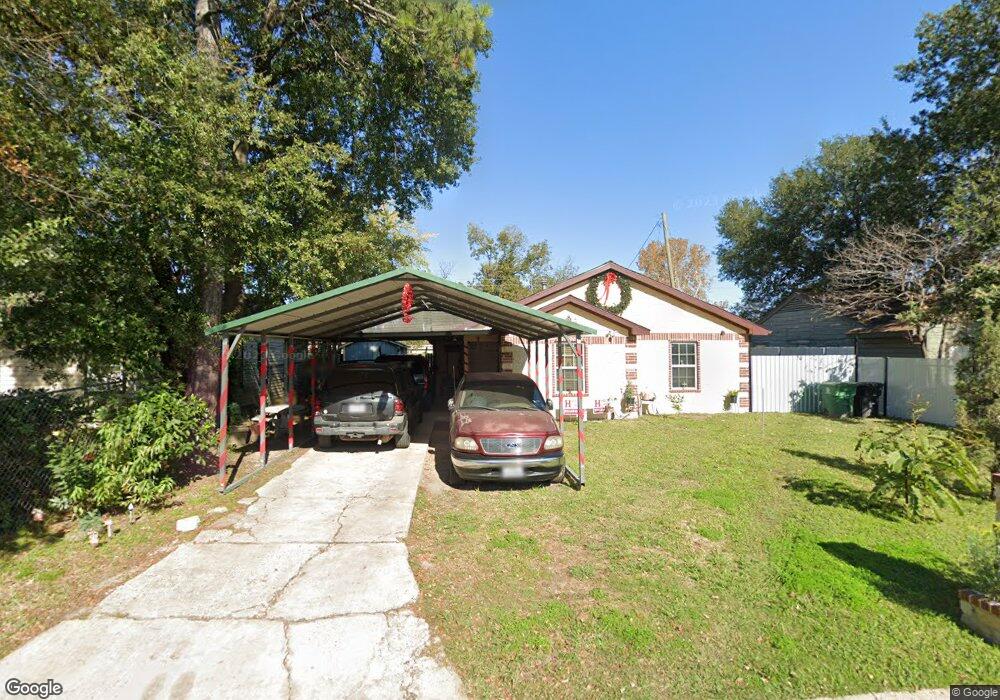
2915 Yorkwood St Houston, TX 77093
Eastex-Jensen NeighborhoodEstimated Value: $124,222 - $166,000
2
Beds
1
Bath
830
Sq Ft
$178/Sq Ft
Est. Value
About This Home
This home is located at 2915 Yorkwood St, Houston, TX 77093 and is currently estimated at $148,056, approximately $178 per square foot. 2915 Yorkwood St is a home located in Harris County with nearby schools including Scarborough Elementary School, Patrick Henry Middle School, and Sam Houston Math, Science & Technology Center.
Ownership History
Date
Name
Owned For
Owner Type
Purchase Details
Closed on
Dec 7, 2009
Sold by
Daniel William R and Daniel Alice F
Bought by
Martinez Jose Ismael and Lopez Olga
Current Estimated Value
Purchase Details
Closed on
Feb 7, 2005
Sold by
Medders Marshall and Medders Lajuana
Bought by
Daniel William R and Daniel Alice F
Home Financials for this Owner
Home Financials are based on the most recent Mortgage that was taken out on this home.
Original Mortgage
$78,000
Interest Rate
7.62%
Mortgage Type
Stand Alone First
Purchase Details
Closed on
Jul 14, 1999
Sold by
Thompson Terry Lee and Thompson Crystal
Bought by
Medders Marshall and Medders Lajuana
Home Financials for this Owner
Home Financials are based on the most recent Mortgage that was taken out on this home.
Original Mortgage
$20,700
Interest Rate
7.39%
Create a Home Valuation Report for This Property
The Home Valuation Report is an in-depth analysis detailing your home's value as well as a comparison with similar homes in the area
Home Values in the Area
Average Home Value in this Area
Purchase History
| Date | Buyer | Sale Price | Title Company |
|---|---|---|---|
| Martinez Jose Ismael | -- | Stewart Title Katy | |
| Daniel William R | -- | Integrity Title | |
| Medders Marshall | -- | -- |
Source: Public Records
Mortgage History
| Date | Status | Borrower | Loan Amount |
|---|---|---|---|
| Previous Owner | Daniel William R | $78,000 | |
| Previous Owner | Medders Marshall | $20,700 |
Source: Public Records
Tax History Compared to Growth
Tax History
| Year | Tax Paid | Tax Assessment Tax Assessment Total Assessment is a certain percentage of the fair market value that is determined by local assessors to be the total taxable value of land and additions on the property. | Land | Improvement |
|---|---|---|---|---|
| 2025 | $1,879 | $97,258 | $42,413 | $54,845 |
| 2024 | $1,879 | $89,801 | $34,956 | $54,845 |
| 2023 | $1,879 | $90,661 | $34,956 | $55,705 |
| 2022 | $1,732 | $78,654 | $23,304 | $55,350 |
| 2021 | $1,441 | $61,818 | $15,147 | $46,671 |
| 2020 | $1,452 | $59,980 | $15,147 | $44,833 |
| 2019 | $1,419 | $56,081 | $12,817 | $43,264 |
| 2018 | $1,058 | $41,809 | $12,817 | $28,992 |
| 2017 | $1,057 | $41,809 | $12,817 | $28,992 |
| 2016 | $979 | $38,726 | $12,817 | $25,909 |
| 2015 | $1,171 | $38,726 | $12,817 | $25,909 |
| 2014 | $1,171 | $45,568 | $12,817 | $32,751 |
Source: Public Records
Map
Nearby Homes
- 1728 Little York Rd
- 1904 Little York Rd
- 2636 Lone Oak Rd
- 2629 Kowis St
- 4918 Langley Rd
- 2817 Cromwell St
- 3418 Hopper Rd
- 2315 Langley Rd
- 3804 Cedar Hill Ln
- 2332 Margaret St
- 2415 Goodloe St
- 3214 Brea Crest St
- 2915 Brea Crest St
- 2311 Warwick Rd
- 2237 Cromwell St
- 2152 William Tell St
- 3202 Parker Rd
- 2122 Kowis St
- 2326 Sunny Dr
- 11716 Innsbury Dr
- 2919 Yorkwood St
- 2911 Yorkwood St
- 2923 Yorkwood St
- 2907 Yorkwood St
- 2916 Yorkwood St
- 2920 Yorkwood St
- 2912 Yorkwood St
- 2927 Yorkwood St
- 2903 Yorkwood St
- 2924 Yorkwood St
- 2908 Yorkwood St
- 2912 Barksdale Dr
- 2916 Barksdale Dr
- 2908 Barksdale Dr
- 2928 Yorkwood St
- 2915 Fleetwood St
- 2931 Yorkwood St
- 2920 Barksdale Dr
- 10748 Royal Pine Dr
- 2919 Fleetwood St