29159 Dutch Bottom Rd Geneseo, IL 61254
Estimated Value: $48,000 - $185,000
3
Beds
--
Bath
1,152
Sq Ft
$86/Sq Ft
Est. Value
About This Home
This home is located at 29159 Dutch Bottom Rd, Geneseo, IL 61254 and is currently estimated at $98,679, approximately $85 per square foot. 29159 Dutch Bottom Rd is a home located in Henry County with nearby schools including Geneseo High School.
Ownership History
Date
Name
Owned For
Owner Type
Purchase Details
Closed on
May 13, 2014
Sold by
Nimrick Gary R and Nimrick Debbie A
Bought by
Ferguson Shane W and Ferguson Angela K
Current Estimated Value
Home Financials for this Owner
Home Financials are based on the most recent Mortgage that was taken out on this home.
Original Mortgage
$28,565
Outstanding Balance
$21,835
Interest Rate
4.41%
Mortgage Type
Purchase Money Mortgage
Estimated Equity
$76,844
Purchase Details
Closed on
Dec 16, 2010
Sold by
Kinyon Mildred and Estate Of George C Lovejoy
Bought by
Nimrick Gary R
Create a Home Valuation Report for This Property
The Home Valuation Report is an in-depth analysis detailing your home's value as well as a comparison with similar homes in the area
Home Values in the Area
Average Home Value in this Area
Purchase History
| Date | Buyer | Sale Price | Title Company |
|---|---|---|---|
| Ferguson Shane W | $39,000 | None Available | |
| Nimrick Gary R | $25,000 | None Available |
Source: Public Records
Mortgage History
| Date | Status | Borrower | Loan Amount |
|---|---|---|---|
| Open | Ferguson Shane W | $28,565 |
Source: Public Records
Tax History Compared to Growth
Tax History
| Year | Tax Paid | Tax Assessment Tax Assessment Total Assessment is a certain percentage of the fair market value that is determined by local assessors to be the total taxable value of land and additions on the property. | Land | Improvement |
|---|---|---|---|---|
| 2024 | $901 | $12,083 | $12,014 | $69 |
| 2023 | $814 | $11,147 | $11,083 | $64 |
| 2022 | $755 | $10,264 | $10,205 | $59 |
| 2021 | $713 | $9,504 | $9,449 | $55 |
| 2020 | $689 | $9,249 | $9,195 | $54 |
| 2019 | $681 | $9,111 | $9,058 | $53 |
| 2018 | $662 | $8,845 | $8,794 | $51 |
| 2017 | $645 | $8,613 | $8,563 | $50 |
| 2016 | $643 | $8,570 | $8,520 | $50 |
| 2015 | $642 | $8,570 | $8,520 | $50 |
| 2013 | $642 | $8,657 | $8,606 | $51 |
Source: Public Records
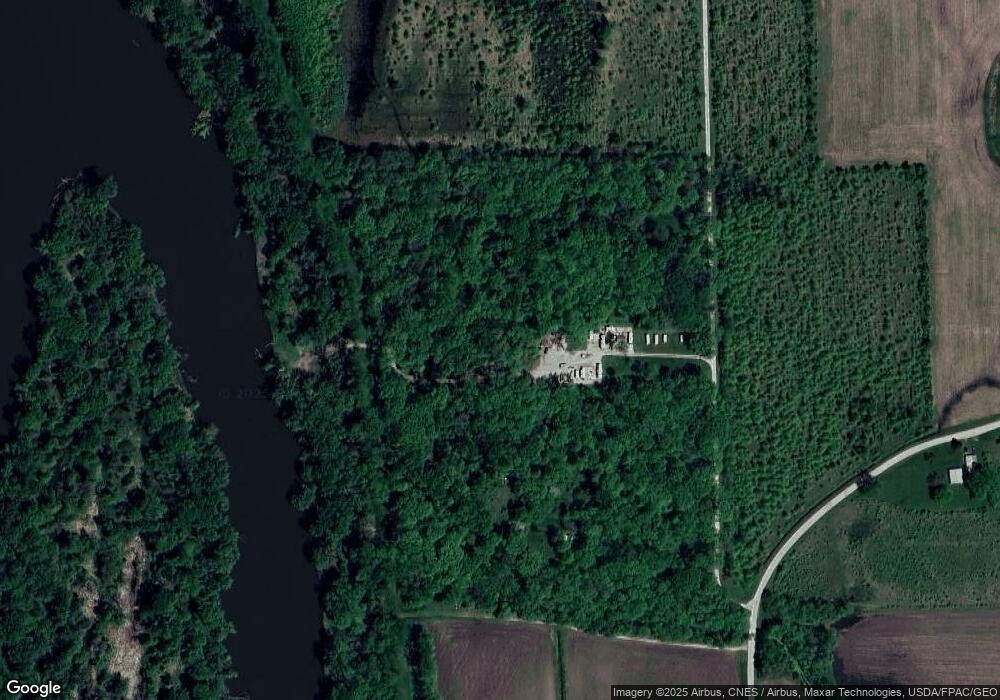
Map
Nearby Homes
- 543 Jackson St
- 424 Docia St
- 12 Timber Ln
- 13 Mary Lane Ct
- 5630 Moline Rd
- 5460 Moline Rd
- 26299 1st Ave N
- 3309 Valley Dr
- 3303 Valley Dr
- 109 Hillcrest Dr
- 226 Longview Ct
- 159 Deer Park Dr
- 211 Longview Dr
- 204 Amber Ln
- 9554 Rock River View
- 7 Oak Grove Rd
- 25622 1st Ave N
- 24620 94th Ave N
- 3917 229th Street Cir N
- 3913 229th Street Cir N
- 29033 Dutch Bottom Rd
- 29250 Ropp Rd
- 29343 Dutch Bottom Rd
- 29411 Dutch Bottom Rd
- 29333 Ropp Rd
- 29260 Ropp Rd
- 29465 Ropp Rd
- 29555 Gooseberry Ln
- 5804 320th St N
- 5718 320th St N
- 29501 Ropp Rd
- 29611 Dutch Bottom Rd
- 29631 Dutch Bottom Rd
- 5801 320th St N
- 29147 Dutch Bottom Rd
- 5321 320th St N
- 5229 321st St N
- 5203 321st St N
- 6200 320th St N
- 6210 320th St N