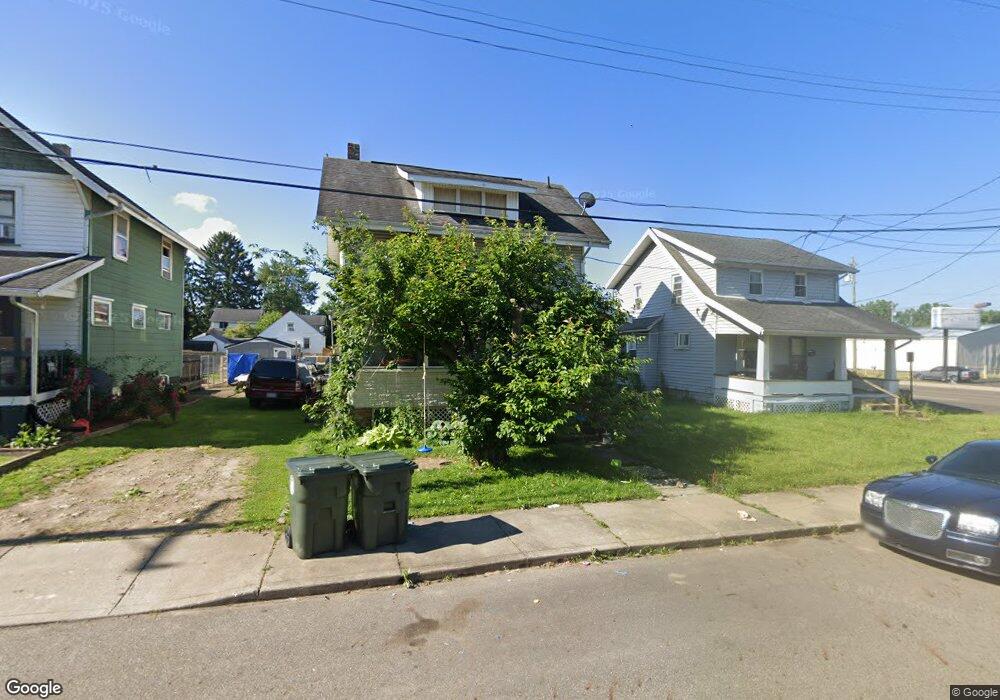
2916 10th St NW Canton, OH 44708
Fairgrounds NeighborhoodEstimated Value: $85,000 - $123,000
3
Beds
2
Baths
1,424
Sq Ft
$70/Sq Ft
Est. Value
About This Home
This home is located at 2916 10th St NW, Canton, OH 44708 and is currently estimated at $99,000, approximately $69 per square foot. 2916 10th St NW is a home located in Stark County with nearby schools including Harter Elementary School, Early Learning Center @ Schreiber, and Clarendon Intermediate School.
Ownership History
Date
Name
Owned For
Owner Type
Purchase Details
Closed on
Jun 11, 2012
Sold by
Larson Todd R and Larson Sherri L
Bought by
Eshelman Daryl and Hurst Tamra
Current Estimated Value
Purchase Details
Closed on
Jan 8, 2010
Sold by
Larson Todd R
Bought by
Guiffre Jacylne and Torgler Christina
Home Financials for this Owner
Home Financials are based on the most recent Mortgage that was taken out on this home.
Original Mortgage
$53,475
Interest Rate
7%
Mortgage Type
Seller Take Back
Purchase Details
Closed on
Dec 22, 2008
Sold by
Fannie Mae
Bought by
Larson Todd
Purchase Details
Closed on
Oct 20, 2008
Sold by
Montague Ronald and Montague Linda S
Bought by
Federal National Mortgage Association
Purchase Details
Closed on
Feb 26, 2001
Sold by
Washington Mutual Bank
Bought by
Montague Ronald
Purchase Details
Closed on
Aug 18, 2000
Sold by
Rohrer Richard C and Rohrer Mary M
Bought by
Washington Mutual Bank
Purchase Details
Closed on
Jan 5, 1994
Create a Home Valuation Report for This Property
The Home Valuation Report is an in-depth analysis detailing your home's value as well as a comparison with similar homes in the area
Home Values in the Area
Average Home Value in this Area
Purchase History
| Date | Buyer | Sale Price | Title Company |
|---|---|---|---|
| Eshelman Daryl | $17,000 | None Available | |
| Guiffre Jacylne | $60,000 | None Available | |
| Larson Todd | $16,000 | None Available | |
| Federal National Mortgage Association | $46,000 | Attorney | |
| Montague Ronald | $33,000 | -- | |
| Washington Mutual Bank | $36,000 | -- | |
| -- | -- | -- |
Source: Public Records
Mortgage History
| Date | Status | Borrower | Loan Amount |
|---|---|---|---|
| Previous Owner | Guiffre Jacylne | $53,475 |
Source: Public Records
Tax History Compared to Growth
Tax History
| Year | Tax Paid | Tax Assessment Tax Assessment Total Assessment is a certain percentage of the fair market value that is determined by local assessors to be the total taxable value of land and additions on the property. | Land | Improvement |
|---|---|---|---|---|
| 2025 | -- | $31,860 | $6,200 | $25,660 |
| 2024 | -- | $31,860 | $6,200 | $25,660 |
| 2023 | $693 | $11,340 | $4,900 | $6,440 |
| 2022 | $677 | $11,340 | $4,900 | $6,440 |
| 2021 | $684 | $11,340 | $4,900 | $6,440 |
| 2020 | $660 | $9,810 | $4,240 | $5,570 |
| 2019 | $359 | $9,810 | $4,240 | $5,570 |
| 2018 | $583 | $9,810 | $4,240 | $5,570 |
| 2017 | $673 | $7,010 | $4,240 | $2,770 |
| 2016 | $888 | $7,010 | $4,240 | $2,770 |
| 2015 | $992 | $14,390 | $4,240 | $10,150 |
| 2014 | $370 | $5,250 | $1,400 | $3,850 |
| 2013 | $181 | $5,250 | $1,400 | $3,850 |
Source: Public Records
Map
Nearby Homes
- 2916 11th St NW
- 811 Broad Ave NW
- 2914 7th St NW
- 0 Brandt Ave NW
- 3200 10th St NW
- 834 Clarendon Ave NW
- 607 Rosemont Ct NW
- 2616 Crown Place NW
- 807 Bedford Ave NW
- 2425 7th St NW
- 521 Columbus Ave NW
- 354 Clarendon Ave NW
- 0 Harrison Ave NW
- 2817 2nd St NW
- 304 Columbus Ave NW
- 3115 2nd St NW
- 3012 16th St NW
- 1314 S Park Ave NW
- 145 Roslyn Ave NW
- 118 Roslyn Ave NW
- 2912 10th St NW
- 914 Wertz Ave NW
- 2908 10th St NW
- 910 Wertz Ave NW
- 2904 10th St NW
- 2915 9th St NW
- 2919 9th St NW
- 900 Wertz Ave NW
- 2917 10th St NW
- 2900 10th St NW
- 2921 10th St NW
- 2915 10th St NW
- 2905 9th St NW
- 2909 10th St NW
- 2824 10th St NW
- 2905 10th St NW
- 2901 9th St NW
- 2901 10th St NW
- 1022 Wertz Ave NW
- 915 Wertz Ave NW