Estimated Value: $136,049 - $146,000
2
Beds
1
Bath
759
Sq Ft
$186/Sq Ft
Est. Value
About This Home
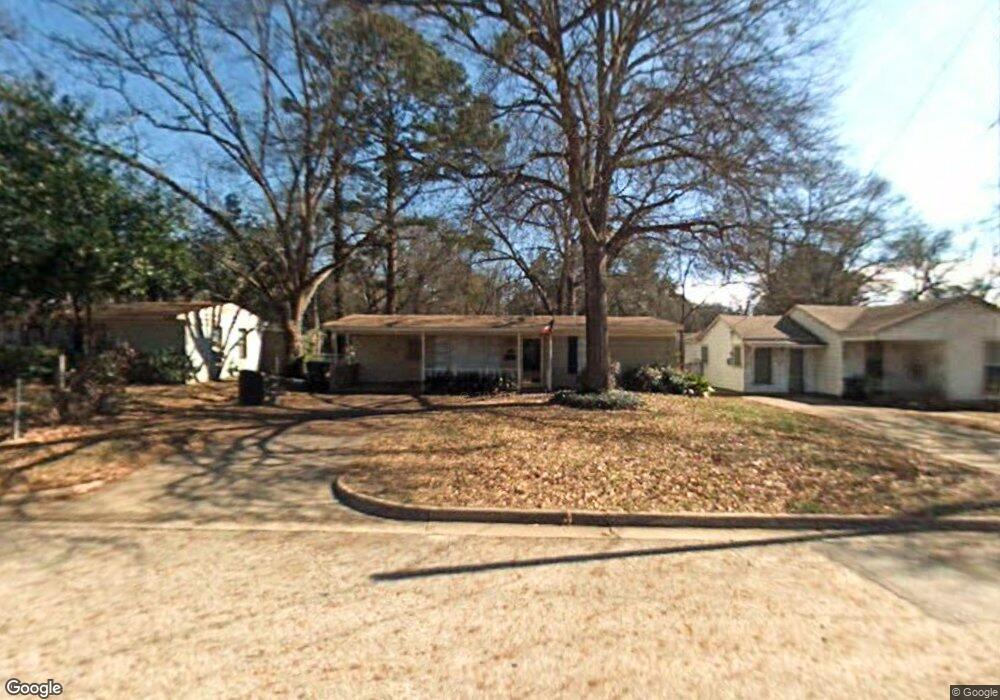
This home is located at 2916 2916 Crestview, Tyler, TX 75701 and is currently estimated at $141,012, approximately $185 per square foot. 2916 2916 Crestview is a home located in Smith County with nearby schools including Woods Elementary School, Hubbard Middle School, and Tyler Legacy High School.
Ownership History
Date
Name
Owned For
Owner Type
Purchase Details
Closed on
Apr 3, 2025
Sold by
Lemmons Phillip C and Lemmons Pamela D
Bought by
Fast Willow Llc
Current Estimated Value
Purchase Details
Closed on
Jun 20, 2024
Sold by
Hfns Properties Llc
Bought by
Lemmons Phillip and Lemmons Pamela D
Home Financials for this Owner
Home Financials are based on the most recent Mortgage that was taken out on this home.
Original Mortgage
$107,175
Interest Rate
7.09%
Mortgage Type
New Conventional
Purchase Details
Closed on
Oct 20, 2015
Sold by
Lane James Alan
Bought by
Hfns Properties Llc
Home Financials for this Owner
Home Financials are based on the most recent Mortgage that was taken out on this home.
Original Mortgage
$56,500
Interest Rate
3.96%
Mortgage Type
Future Advance Clause Open End Mortgage
Purchase Details
Closed on
Oct 4, 2005
Sold by
2916 Crestview Trust and Anderson Jim
Bought by
Lane James Alan
Create a Home Valuation Report for This Property
The Home Valuation Report is an in-depth analysis detailing your home's value as well as a comparison with similar homes in the area
Home Values in the Area
Average Home Value in this Area
Purchase History
| Date | Buyer | Sale Price | Title Company |
|---|---|---|---|
| Fast Willow Llc | -- | None Listed On Document | |
| Lemmons Phillip | -- | None Listed On Document | |
| Hfns Properties Llc | -- | None Available | |
| Lane James Alan | -- | None Available |
Source: Public Records
Mortgage History
| Date | Status | Borrower | Loan Amount |
|---|---|---|---|
| Previous Owner | Lemmons Phillip | $107,175 | |
| Previous Owner | Hfns Properties Llc | $56,500 |
Source: Public Records
Tax History Compared to Growth
Tax History
| Year | Tax Paid | Tax Assessment Tax Assessment Total Assessment is a certain percentage of the fair market value that is determined by local assessors to be the total taxable value of land and additions on the property. | Land | Improvement |
|---|---|---|---|---|
| 2025 | $1,771 | $103,317 | $37,396 | $65,921 |
| 2024 | $1,771 | $104,130 | $21,930 | $83,600 |
| 2023 | $1,513 | $86,775 | $21,930 | $64,845 |
| 2022 | $1,435 | $73,260 | $20,029 | $53,231 |
| 2021 | $1,039 | $49,537 | $20,029 | $29,508 |
| 2020 | $1,051 | $49,121 | $20,029 | $29,092 |
| 2019 | $1,124 | $51,379 | $20,029 | $31,350 |
| 2018 | $1,000 | $45,970 | $14,620 | $31,350 |
| 2017 | $981 | $45,970 | $14,620 | $31,350 |
| 2016 | $953 | $44,647 | $14,620 | $30,027 |
| 2015 | $957 | $43,651 | $14,620 | $29,031 |
| 2014 | $957 | $45,042 | $14,620 | $30,422 |
Source: Public Records
Map
Nearby Homes
- 611 E Watkins St
- 315 Ridgecrest Dr
- 3202 S Donnybrook Ave
- 317 Amberwood Cir
- 3210 S Donnybrook Ave
- 905 E Watkins St
- 2835 S Broadway Ave
- 121 Fair Ln
- 904 E Dulse St
- 2736 Old Bullard Rd
- 1024 Clyde Dr
- 1018 Pollard Dr
- 1101 Clyde Dr
- 1102 S Peach Ave S
- 515 & 517 Charnwood St
- 3922 & 3928 McDonald Rd
- 309 Glenhaven Dr
- 3300 Old Bullard Rd
- 3006 de Charles St
- 403 Beechwood Dr
- 2916 Crestview St
- 2926 2926 Crestview
- 2926 Crestview St
- 2914 Crestview St
- 2930 Crestview St
- 2917 Crestview St
- 2925 Crestview St
- 2912 Crestview St
- 2913 Crestview St
- 2929 Crestview St
- 2909 Crestview St
- 2923 New Copeland Rd
- 2927 New Copeland Rd
- 2915 New Copeland Rd
- 3001 Crestview St
- 2931 New Copeland Rd
- 3004 3004 Crestview Ave
- 2903 Crestview St
- 2927 2927 Copeland Rd
- 3004 Crestview St