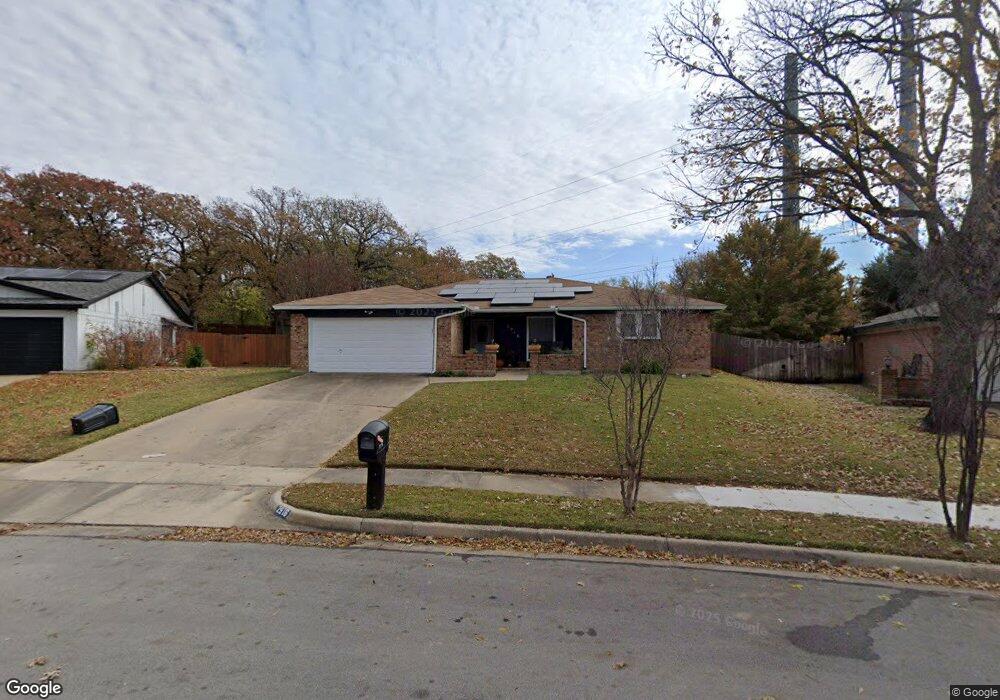
2916 Bluebonnet Ln Bedford, TX 76021
Estimated Value: $382,253 - $431,000
3
Beds
2
Baths
1,719
Sq Ft
$236/Sq Ft
Est. Value
About This Home
This home is located at 2916 Bluebonnet Ln, Bedford, TX 76021 and is currently estimated at $405,563, approximately $235 per square foot. 2916 Bluebonnet Ln is a home located in Tarrant County with nearby schools including Spring Garden Elementary School, Harwood Junior High School, and Trinity High School.
Ownership History
Date
Name
Owned For
Owner Type
Purchase Details
Closed on
Apr 14, 2016
Sold by
Richard Aaron M and Day Nicole R
Bought by
Garcia Gregory and Garcia Ashlee
Current Estimated Value
Home Financials for this Owner
Home Financials are based on the most recent Mortgage that was taken out on this home.
Original Mortgage
$216,600
Outstanding Balance
$171,849
Interest Rate
3.64%
Mortgage Type
New Conventional
Estimated Equity
$233,714
Purchase Details
Closed on
Jun 1, 2005
Sold by
Stewart James David and Stewart Karen
Bought by
Richard Aaron M and Day Nicole R
Home Financials for this Owner
Home Financials are based on the most recent Mortgage that was taken out on this home.
Original Mortgage
$122,800
Interest Rate
5.79%
Mortgage Type
Fannie Mae Freddie Mac
Create a Home Valuation Report for This Property
The Home Valuation Report is an in-depth analysis detailing your home's value as well as a comparison with similar homes in the area
Home Values in the Area
Average Home Value in this Area
Purchase History
| Date | Buyer | Sale Price | Title Company |
|---|---|---|---|
| Garcia Gregory | -- | Capital Title | |
| Richard Aaron M | -- | -- |
Source: Public Records
Mortgage History
| Date | Status | Borrower | Loan Amount |
|---|---|---|---|
| Open | Garcia Gregory | $216,600 | |
| Previous Owner | Richard Aaron M | $122,800 | |
| Closed | Richard Aaron M | $30,700 |
Source: Public Records
Tax History Compared to Growth
Tax History
| Year | Tax Paid | Tax Assessment Tax Assessment Total Assessment is a certain percentage of the fair market value that is determined by local assessors to be the total taxable value of land and additions on the property. | Land | Improvement |
|---|---|---|---|---|
| 2025 | $6,297 | $390,858 | $70,000 | $320,858 |
| 2024 | $6,297 | $390,858 | $70,000 | $320,858 |
| 2023 | $6,970 | $363,380 | $45,000 | $318,380 |
| 2022 | $7,255 | $332,187 | $45,000 | $287,187 |
| 2021 | $7,172 | $322,760 | $45,000 | $277,760 |
| 2020 | $6,581 | $276,791 | $45,000 | $231,791 |
| 2019 | $6,435 | $282,296 | $45,000 | $237,296 |
| 2018 | $5,468 | $240,797 | $45,000 | $195,797 |
| 2017 | $5,825 | $240,803 | $30,000 | $210,803 |
| 2016 | $4,577 | $206,542 | $30,000 | $176,542 |
| 2015 | $4,155 | $172,000 | $30,000 | $142,000 |
| 2014 | $4,155 | $176,400 | $18,000 | $158,400 |
Source: Public Records
Map
Nearby Homes
- 3017 Bluebonnet Ln
- 3405 Scenic Hills Dr
- 3001 Glenwood Ct
- 3024 Pecan Cir
- 3013 Bent Tree Ln
- 2709 Willow Bend
- 2600 Willow Bend
- 3024 Highgate Ln
- 3152 Woodbridge Dr
- 3816 Rolling Meadows Dr
- 3721 Fieldcrest Ln
- 3112 Hazlewood Ct
- 2616 Greenwood Ct
- 3205 Princess St
- 2609 Talisman Ct
- 2922 Beachtree Ln
- 3209 Misty Ct
- 4001 Fairmont Ct
- 3909 Allendale St
- 3428 Pembroke Place
- 2912 Bluebonnet Ln
- 2920 Bluebonnet Ln
- 2900 Magnolia Ct
- 2908 Bluebonnet Ln
- 3000 Bluebonnet Ln
- 2904 Magnolia Ct
- 2909 Bluebonnet Ln
- 3001 Bluebonnet Ln
- 3004 Bluebonnet Ln
- 3309 Red Oak Ln
- 2904 Bluebonnet Ln
- 2901 Magnolia Ct
- 3005 Bluebonnet Ln
- 3400 Primrose Ln
- 2901 White Oak Ln
- 2908 Magnolia Ct
- 2900 Bluebonnet Ln
- 3404 Primrose Ln
- 3008 Bluebonnet Ln
- 3305 Red Oak Ln