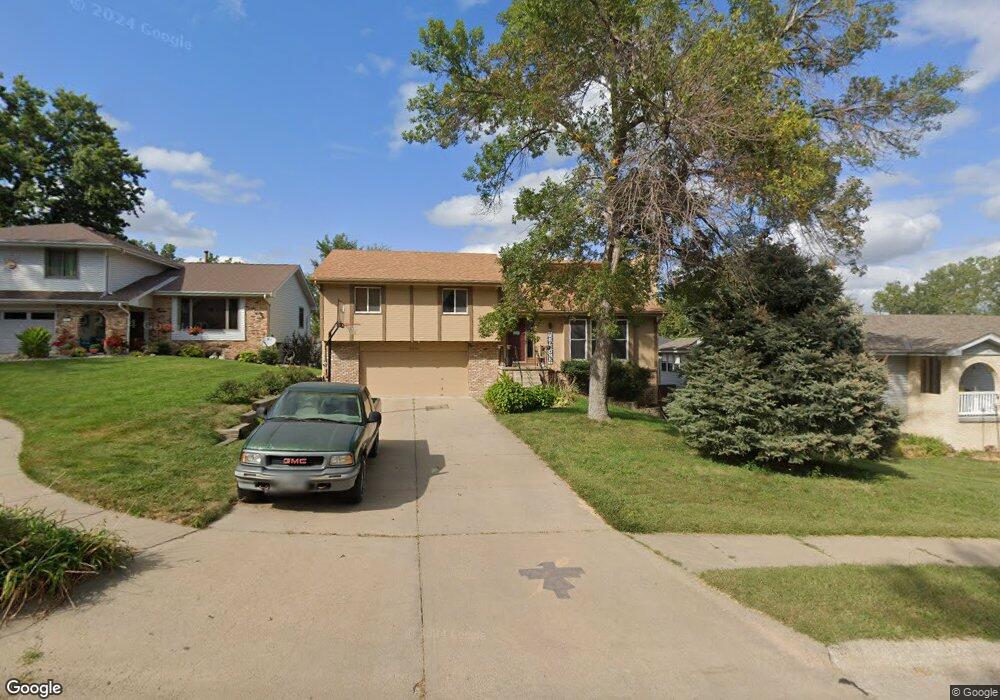
2916 Daniell Cir Bellevue, NE 68123
Estimated Value: $285,000 - $317,000
3
Beds
5
Baths
1,816
Sq Ft
$165/Sq Ft
Est. Value
About This Home
This home is located at 2916 Daniell Cir, Bellevue, NE 68123 and is currently estimated at $299,069, approximately $164 per square foot. 2916 Daniell Cir is a home located in Sarpy County with nearby schools including Leonard Lawrence Elementary School, Lewis & Clark Middle School, and Bellevue West High School.
Ownership History
Date
Name
Owned For
Owner Type
Purchase Details
Closed on
Jul 21, 2004
Sold by
Homecomings Financial Network Inc
Bought by
Woodard Terrence L and Woodard Jennifer M
Current Estimated Value
Home Financials for this Owner
Home Financials are based on the most recent Mortgage that was taken out on this home.
Original Mortgage
$92,100
Outstanding Balance
$46,252
Interest Rate
6.3%
Estimated Equity
$252,817
Purchase Details
Closed on
May 27, 2004
Sold by
Belman Keith E
Bought by
Homecomings Financial Network Inc
Home Financials for this Owner
Home Financials are based on the most recent Mortgage that was taken out on this home.
Original Mortgage
$92,100
Outstanding Balance
$46,252
Interest Rate
6.3%
Estimated Equity
$252,817
Purchase Details
Closed on
Oct 3, 2001
Sold by
Fleming Kevin F and Fleming Debra
Bought by
Belman Keith
Home Financials for this Owner
Home Financials are based on the most recent Mortgage that was taken out on this home.
Original Mortgage
$128,981
Interest Rate
6.84%
Create a Home Valuation Report for This Property
The Home Valuation Report is an in-depth analysis detailing your home's value as well as a comparison with similar homes in the area
Home Values in the Area
Average Home Value in this Area
Purchase History
| Date | Buyer | Sale Price | Title Company |
|---|---|---|---|
| Woodard Terrence L | $116,000 | -- | |
| Homecomings Financial Network Inc | $119,000 | -- | |
| Belman Keith | $130,000 | Midlands Land Title & Abstra |
Source: Public Records
Mortgage History
| Date | Status | Borrower | Loan Amount |
|---|---|---|---|
| Open | Woodard Terrence L | $92,100 | |
| Previous Owner | Belman Keith | $128,981 | |
| Closed | Woodard Terrence L | $23,025 |
Source: Public Records
Tax History Compared to Growth
Tax History
| Year | Tax Paid | Tax Assessment Tax Assessment Total Assessment is a certain percentage of the fair market value that is determined by local assessors to be the total taxable value of land and additions on the property. | Land | Improvement |
|---|---|---|---|---|
| 2025 | $4,196 | $257,777 | $46,000 | $211,777 |
| 2024 | $4,757 | $241,173 | $44,000 | $197,173 |
| 2023 | $4,757 | $225,277 | $39,000 | $186,277 |
| 2022 | $4,353 | $202,287 | $35,000 | $167,287 |
| 2021 | $4,069 | $187,051 | $30,000 | $157,051 |
| 2020 | $3,907 | $179,034 | $30,000 | $149,034 |
| 2019 | $3,784 | $174,508 | $30,000 | $144,508 |
| 2018 | $3,552 | $168,219 | $25,000 | $143,219 |
| 2017 | $3,331 | $156,664 | $25,000 | $131,664 |
| 2016 | $3,161 | $151,947 | $25,000 | $126,947 |
| 2015 | $3,072 | $148,534 | $25,000 | $123,534 |
| 2014 | $2,949 | $141,647 | $25,000 | $116,647 |
| 2012 | -- | $143,227 | $25,000 | $118,227 |
Source: Public Records
Map
Nearby Homes
- 2940 Leawood Dr
- 12901 S 29th Place
- 3102 Redwing Dr
- 12722 S 28th Ave
- 3105 Leawood Dr
- 3108 Mirror Cir
- 3105 Mirror Cir
- 13403 S 28th St
- 2512 Nottingham Dr
- 3309 Lookingglass Dr
- 2923 Blackhawk Dr
- 3506 Lynnwood Dr
- 3504 Sheridan Cir
- 12915 Forestdale Dr
- 3508 Jason Cir
- 12750 Forestdale Dr
- 3728 Schuemann Dr
- 12741 Ridgeview Cir
- 3738 Falcon Dr
- 13902 Rahn Blvd
- 2914 Daniell Cir
- 2918 Daniell Cir
- 12904 S 29th St
- 2920 Daniell Cir
- 2915 Redwing Cir
- 2917 Redwing Cir
- 2915 Daniell Cir
- 2913 Redwing Cir
- 2913 Daniell Cir
- 2910 Daniell Cir
- 2910 Daniell Cir
- 2922 Daniell Cir
- 2911 Redwing Cir
- 2917 Daniell Cir
- 12903 S 29th St
- 2919 Redwing Cir
- 2919 Daniell Cir
- 2909 Daniell Cir
- 2908 Daniell Cir
- 12911 S 29th Ave