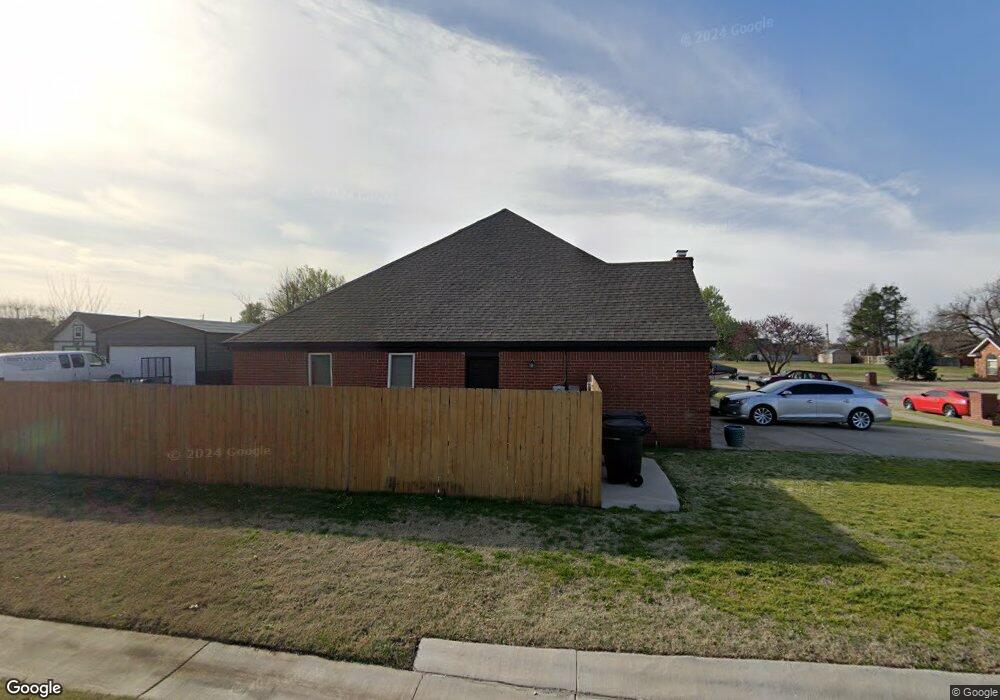
2916 Kyle Ct Moore, OK 73160
Springfield NeighborhoodEstimated Value: $262,123 - $287,000
3
Beds
3
Baths
1,906
Sq Ft
$143/Sq Ft
Est. Value
About This Home
This home is located at 2916 Kyle Ct, Moore, OK 73160 and is currently estimated at $272,281, approximately $142 per square foot. 2916 Kyle Ct is a home located in Cleveland County with nearby schools including Houchin Elementary School, West Junior High School, and Westmoore High School.
Ownership History
Date
Name
Owned For
Owner Type
Purchase Details
Closed on
Sep 14, 2012
Sold by
Slater Steven K
Bought by
Maciel Johnny R
Current Estimated Value
Home Financials for this Owner
Home Financials are based on the most recent Mortgage that was taken out on this home.
Original Mortgage
$150,621
Outstanding Balance
$102,977
Interest Rate
3.62%
Mortgage Type
FHA
Estimated Equity
$169,304
Purchase Details
Closed on
Jun 17, 2010
Sold by
Slater Steven K
Bought by
Slater Steven K and The Steven Slater Living Trust
Purchase Details
Closed on
Jun 17, 2009
Sold by
Slater Steven K
Bought by
Slater Steven K and The Steven Slater Family Trust
Purchase Details
Closed on
Dec 21, 2005
Sold by
Slater Steven K
Bought by
Cindy Slater Family Trust
Create a Home Valuation Report for This Property
The Home Valuation Report is an in-depth analysis detailing your home's value as well as a comparison with similar homes in the area
Home Values in the Area
Average Home Value in this Area
Purchase History
| Date | Buyer | Sale Price | Title Company |
|---|---|---|---|
| Maciel Johnny R | $153,500 | None Available | |
| Slater Steven K | -- | None Available | |
| Slater Steven K | -- | None Available | |
| Cindy Slater Family Trust | -- | None Available |
Source: Public Records
Mortgage History
| Date | Status | Borrower | Loan Amount |
|---|---|---|---|
| Open | Maciel Johnny R | $150,621 |
Source: Public Records
Tax History
| Year | Tax Paid | Tax Assessment Tax Assessment Total Assessment is a certain percentage of the fair market value that is determined by local assessors to be the total taxable value of land and additions on the property. | Land | Improvement |
|---|---|---|---|---|
| 2025 | $3,173 | $25,915 | $4,193 | $21,722 |
| 2024 | $2,994 | $24,681 | $4,000 | $20,681 |
| 2023 | $2,553 | $20,950 | $3,498 | $17,452 |
| 2022 | $2,467 | $19,952 | $3,347 | $16,605 |
| 2021 | $2,361 | $19,002 | $3,313 | $15,689 |
| 2020 | $2,250 | $18,098 | $3,097 | $15,001 |
| 2019 | $2,182 | $17,236 | $3,000 | $14,236 |
| 2018 | $2,183 | $17,236 | $3,000 | $14,236 |
| 2017 | $2,194 | $17,236 | $0 | $0 |
| 2016 | $2,211 | $17,236 | $3,000 | $14,236 |
| 2015 | $1,999 | $17,236 | $3,000 | $14,236 |
| 2014 | $1,979 | $16,664 | $1,076 | $15,588 |
Source: Public Records
Map
Nearby Homes
- 24 SW 100th St
- 3001 Prairie Field Ln
- 4 SW 98th St
- 113 SW 99th St
- 10108 S Ranchwood Manor Dr
- 825 NW 34th St
- 2704 Yorkshire Ave
- 1048 NW 25th St
- 113 W Ranchwood Ct
- 2508 Yorkshire Ave
- 2413 Queensbury Rd
- 4 SW 92nd Place
- 40 SW 92nd Place
- 2404 Piccadilly Cir
- 9306 S Harvey Ave
- 600 SW 104th Place
- 609 SW 104th Place
- 9322 S Hudson Ave
- 613 SW 104th Place
- 9322 Charwood Dr
Your Personal Tour Guide
Ask me questions while you tour the home.