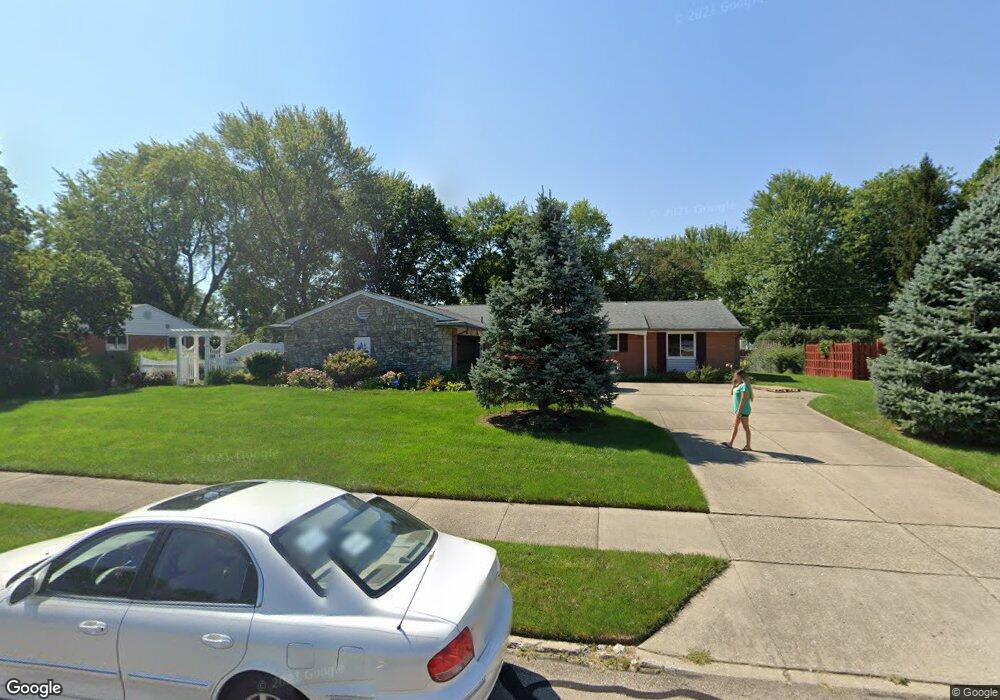
2916 Swigert Rd Kettering, OH 45440
Estimated Value: $297,830 - $317,000
3
Beds
3
Baths
1,724
Sq Ft
$178/Sq Ft
Est. Value
About This Home
This home is located at 2916 Swigert Rd, Kettering, OH 45440 and is currently estimated at $306,708, approximately $177 per square foot. 2916 Swigert Rd is a home located in Montgomery County with nearby schools including Prass Elementary School, Kettering Middle School, and Kettering Fairmont High School.
Ownership History
Date
Name
Owned For
Owner Type
Purchase Details
Closed on
Dec 16, 2021
Sold by
Kirchner Jerry L and Kirchner Family Trust
Bought by
Stamper James R and Stamper Elise
Current Estimated Value
Home Financials for this Owner
Home Financials are based on the most recent Mortgage that was taken out on this home.
Original Mortgage
$245,471
Interest Rate
3.22%
Mortgage Type
FHA
Purchase Details
Closed on
May 28, 2021
Sold by
Nash Cathy A and Estate Of Barbara J Wheeler
Bought by
Kirchner Jerry L and The Kirchner Family Trust
Purchase Details
Closed on
Nov 16, 2010
Sold by
Luther Robert E and Luther Jacqueline S
Bought by
Wheeler Jimmie T and Wheeler Barbara J
Purchase Details
Closed on
Dec 4, 2009
Sold by
Luther Robert E and Luther Jacqueline S
Bought by
Luther Robert E and Luther Jacqueline S
Purchase Details
Closed on
Jun 19, 2007
Sold by
Badgley Mildred J
Bought by
Luther Robert E
Create a Home Valuation Report for This Property
The Home Valuation Report is an in-depth analysis detailing your home's value as well as a comparison with similar homes in the area
Home Values in the Area
Average Home Value in this Area
Purchase History
| Date | Buyer | Sale Price | Title Company |
|---|---|---|---|
| Stamper James R | -- | Landmark Title | |
| Kirchner Jerry L | $220,000 | None Available | |
| Wheeler Jimmie T | $167,000 | Attorney | |
| Luther Robert E | -- | None Available | |
| Luther Robert E | $160,000 | Attorney |
Source: Public Records
Mortgage History
| Date | Status | Borrower | Loan Amount |
|---|---|---|---|
| Previous Owner | Stamper James R | $245,471 |
Source: Public Records
Tax History Compared to Growth
Tax History
| Year | Tax Paid | Tax Assessment Tax Assessment Total Assessment is a certain percentage of the fair market value that is determined by local assessors to be the total taxable value of land and additions on the property. | Land | Improvement |
|---|---|---|---|---|
| 2024 | $4,829 | $77,920 | $12,970 | $64,950 |
| 2023 | $4,829 | $77,920 | $12,970 | $64,950 |
| 2022 | $5,168 | $64,640 | $10,720 | $53,920 |
| 2021 | $4,787 | $64,640 | $10,720 | $53,920 |
| 2020 | $4,063 | $64,640 | $10,720 | $53,920 |
| 2019 | $3,640 | $52,990 | $10,720 | $42,270 |
| 2018 | $3,659 | $52,990 | $10,720 | $42,270 |
| 2017 | $3,370 | $52,990 | $10,720 | $42,270 |
| 2016 | $2,996 | $45,680 | $10,720 | $34,960 |
| 2015 | $2,863 | $45,680 | $10,720 | $34,960 |
| 2014 | $2,863 | $45,680 | $10,720 | $34,960 |
| 2012 | -- | $53,000 | $10,590 | $42,410 |
Source: Public Records
Map
Nearby Homes
- 3034 Sandywood Dr
- 3117 Swigert Rd
- 861 Acorn Dr
- 2648 Parklawn Dr
- 4901 Wilmington Pike
- 4824 Rean Meadow Dr
- 4533 Drayton Ct
- 2816 Corlington Dr
- 2579 Walford Dr
- 2841 Corlington Dr
- 2405 Westlawn Dr
- 4408 Glenheath Dr
- 4464 Woodner Dr
- 4508 Rean Meadow Dr
- 5052 Dobbs Dr
- 2409 Burning Tree Dr
- 470 Cloverhill Ct
- 2447 Hemphill Rd
- 2313 Glenheath Dr
- 2386 E Rahn Rd
- 2916 Swigart Rd
- 0 Swigert Rd Unit 731830
- 2900 Swigart Rd
- 2932 Swigart Rd
- 2925 Coker Dr
- 2917 Coker Dr
- 2933 Coker Dr
- 2853 Swigart Rd
- 2853 Swigert Rd
- 2848 Swigart Rd
- 2951 Swigart Rd
- 2848 Swigert Rd
- 3000 Swigart Rd
- 3000 Swigert Rd
- 2829 Swigart Rd
- 2909 Coker Dr
- 4580 Timberwilde Dr
- 2941 Coker Dr
- 2832 Swigart Rd
- 3001 Swigert Rd