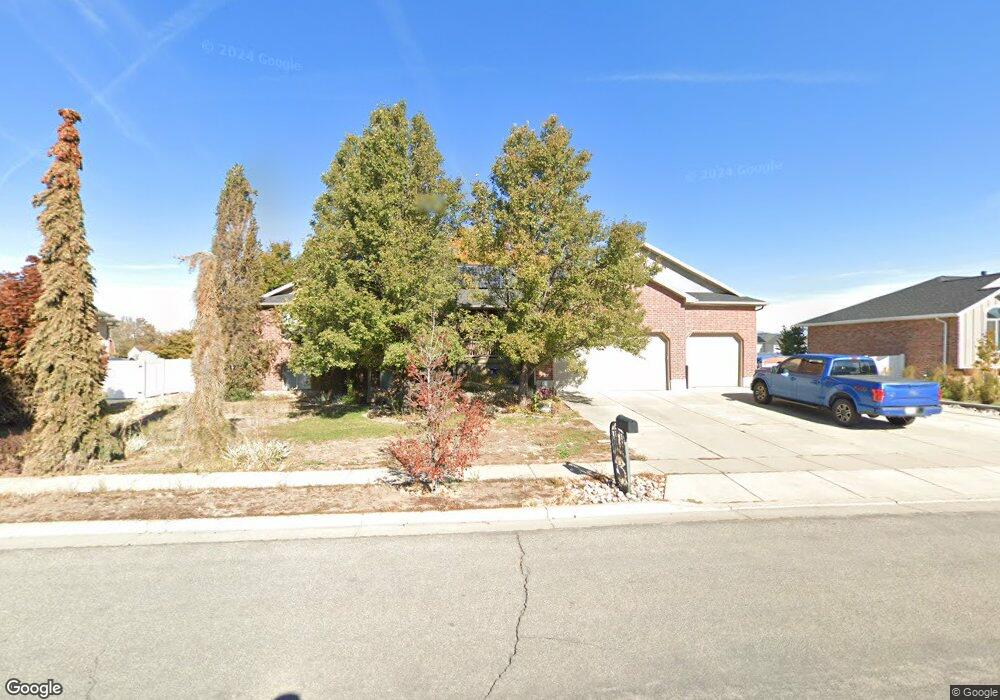
2916 W 1010 N Clearfield, UT 84015
Estimated Value: $609,000 - $682,396
--
Bed
3
Baths
1,841
Sq Ft
$358/Sq Ft
Est. Value
About This Home
This home is located at 2916 W 1010 N, Clearfield, UT 84015 and is currently estimated at $658,849, approximately $357 per square foot. 2916 W 1010 N is a home located in Davis County with nearby schools including Lakeside School, West Point Junior High School, and Syracuse High School.
Ownership History
Date
Name
Owned For
Owner Type
Purchase Details
Closed on
Jul 16, 2014
Sold by
Jones Michael and Michele Jones A
Bought by
Jones Michael W and Michele Jones A
Current Estimated Value
Home Financials for this Owner
Home Financials are based on the most recent Mortgage that was taken out on this home.
Original Mortgage
$217,400
Outstanding Balance
$65,787
Interest Rate
3.19%
Mortgage Type
New Conventional
Estimated Equity
$593,062
Purchase Details
Closed on
Aug 8, 2002
Sold by
Craythorne Construction Co Inc
Bought by
Jones Michael and Michele Jones A
Home Financials for this Owner
Home Financials are based on the most recent Mortgage that was taken out on this home.
Original Mortgage
$202,000
Interest Rate
6.52%
Create a Home Valuation Report for This Property
The Home Valuation Report is an in-depth analysis detailing your home's value as well as a comparison with similar homes in the area
Home Values in the Area
Average Home Value in this Area
Purchase History
| Date | Buyer | Sale Price | Title Company |
|---|---|---|---|
| Jones Michael W | -- | Backman Title Service | |
| Jones Michael | -- | Bonneville Title Company Inc | |
| Craythorne Construction Co Inc | -- | Bonneville Title Company Inc |
Source: Public Records
Mortgage History
| Date | Status | Borrower | Loan Amount |
|---|---|---|---|
| Open | Jones Michael W | $217,400 | |
| Closed | Jones Michael | $202,000 |
Source: Public Records
Tax History Compared to Growth
Tax History
| Year | Tax Paid | Tax Assessment Tax Assessment Total Assessment is a certain percentage of the fair market value that is determined by local assessors to be the total taxable value of land and additions on the property. | Land | Improvement |
|---|---|---|---|---|
| 2025 | $3,443 | $331,100 | $106,884 | $224,216 |
| 2024 | $3,482 | $336,600 | $115,653 | $220,947 |
| 2023 | $3,282 | $587,000 | $134,812 | $452,188 |
| 2022 | $3,519 | $348,150 | $78,565 | $269,585 |
| 2021 | $3,318 | $487,000 | $105,006 | $381,994 |
| 2020 | $2,912 | $423,000 | $92,940 | $330,060 |
| 2019 | $2,826 | $401,000 | $101,802 | $299,198 |
| 2018 | $2,661 | $371,000 | $85,131 | $285,869 |
| 2016 | $2,420 | $174,240 | $32,396 | $141,844 |
| 2015 | $2,452 | $167,805 | $32,396 | $135,409 |
| 2014 | $2,287 | $158,994 | $32,396 | $126,598 |
| 2013 | -- | $155,122 | $31,860 | $123,262 |
Source: Public Records
Map
Nearby Homes