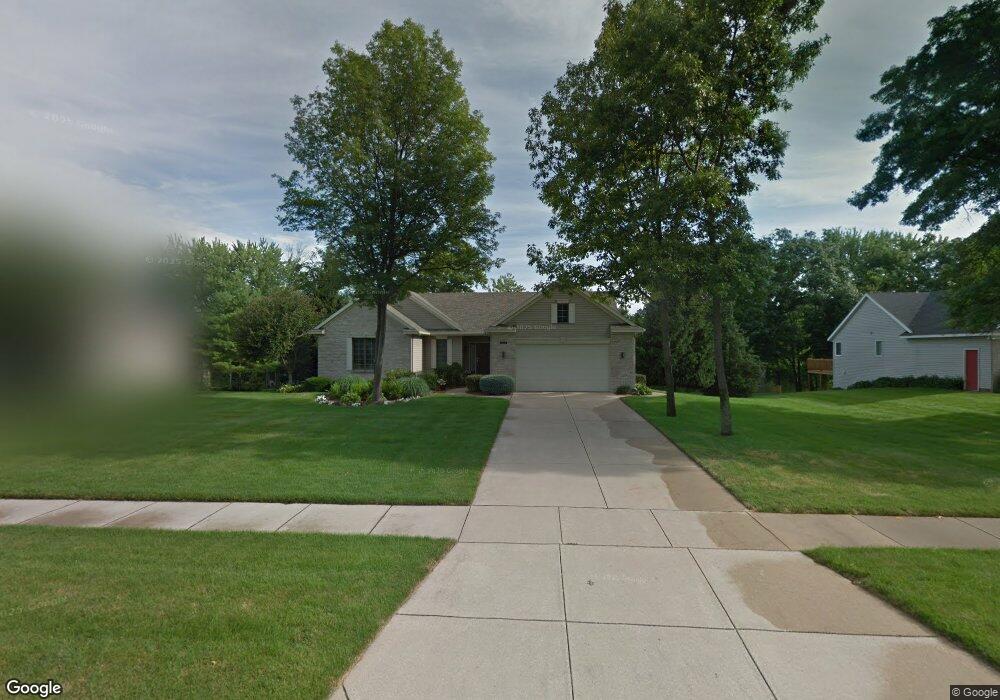
2917 Fingers Dr NE Grand Rapids, MI 49525
Northview NeighborhoodEstimated Value: $399,000 - $529,000
3
Beds
4
Baths
1
Sq Ft
$474,800/Sq Ft
Est. Value
About This Home
This home is located at 2917 Fingers Dr NE, Grand Rapids, MI 49525 and is currently estimated at $474,800, approximately $474,800 per square foot. 2917 Fingers Dr NE is a home located in Kent County with nearby schools including West Oakview Elementary School, East Oakview Elementary School, and North Oakview Elementary School.
Ownership History
Date
Name
Owned For
Owner Type
Purchase Details
Closed on
Mar 31, 2025
Sold by
Niehof Thomas and Niehof Stephanie Carol
Bought by
Niehof Thomas A and Niehof Stephanie C
Current Estimated Value
Purchase Details
Closed on
Sep 6, 2019
Sold by
Barbara A Zcitter Trust
Bought by
Niehof Thomas and Niehof Stephanie Carol
Home Financials for this Owner
Home Financials are based on the most recent Mortgage that was taken out on this home.
Original Mortgage
$255,200
Interest Rate
3.7%
Mortgage Type
New Conventional
Purchase Details
Closed on
Nov 9, 2016
Sold by
Zeitter Barbara A and Charles R Zeitter Trust
Bought by
Zeitter Barbara A and Wolf Christine A
Purchase Details
Closed on
Sep 30, 1999
Sold by
Zeitter Charles R
Bought by
Zeitter Charles R Trust and Zeitter Charles R Trust
Purchase Details
Closed on
Dec 21, 1995
Sold by
Barlow Charles
Bought by
Zeitter Charles R and Zeitter Charles R Trust
Create a Home Valuation Report for This Property
The Home Valuation Report is an in-depth analysis detailing your home's value as well as a comparison with similar homes in the area
Home Values in the Area
Average Home Value in this Area
Purchase History
| Date | Buyer | Sale Price | Title Company |
|---|---|---|---|
| Niehof Thomas A | -- | None Listed On Document | |
| Niehof Thomas | $319,000 | None Available | |
| Zeitter Barbara A | -- | None Available | |
| Zeitter Charles R Trust | -- | -- | |
| Zeitter Charles R | $225,000 | -- |
Source: Public Records
Mortgage History
| Date | Status | Borrower | Loan Amount |
|---|---|---|---|
| Previous Owner | Niehof Thomas | $255,200 |
Source: Public Records
Tax History Compared to Growth
Tax History
| Year | Tax Paid | Tax Assessment Tax Assessment Total Assessment is a certain percentage of the fair market value that is determined by local assessors to be the total taxable value of land and additions on the property. | Land | Improvement |
|---|---|---|---|---|
| 2025 | $3,848 | $214,000 | $0 | $0 |
| 2024 | $3,848 | $201,800 | $0 | $0 |
| 2023 | $3,681 | $239,400 | $0 | $0 |
| 2022 | $5,433 | $174,300 | $0 | $0 |
| 2021 | $5,291 | $166,500 | $0 | $0 |
| 2020 | $3,391 | $156,700 | $0 | $0 |
| 2019 | $4,180 | $145,000 | $0 | $0 |
| 2018 | $4,093 | $126,600 | $0 | $0 |
| 2017 | $3,986 | $130,000 | $0 | $0 |
| 2016 | $3,852 | $125,500 | $0 | $0 |
| 2015 | $3,809 | $125,500 | $0 | $0 |
| 2013 | -- | $114,600 | $0 | $0 |
Source: Public Records
Map
Nearby Homes
- 5741 Coit Ave NE
- 4740 Paramount Dr NE
- 4785 Rockvalley Dr NE
- 5605 Coit Ave NE
- 4820 Ridgeline Dr NE
- 4847 Ridgeline Dr NE
- 4683 Rockvalley Dr NE Unit 2
- 3364 Devonwood Hills NE Unit F
- 3396 Devonwood Hills NE Unit D
- 3396 Devonwood Hills NE Unit C
- 4611 Plainfield Ave NE
- 4495 Trail View NE
- 3285 Woodwind Dr NE Unit 46
- 6667 W River Dr NE
- 2233 Airway St NE
- 2285-2289 Airway St NE
- 2289 Airway St NE
- 2285 Airway St NE
- 5073 Coit Ave NE
- 2110 Daylor Dr NE
- 2925 Fingers Dr NE
- 2911 Fingers Dr NE
- 2916 Fingers Dr NE
- 2939 Fingers Dr NE
- 2905 Fingers Dr NE
- 2908 Fingers Dr NE
- 2928 Fingers Dr NE
- 2940 Fingers Dr NE
- 5913 Coit Ave NE
- 2894 Fingers Dr NE
- 2952 Fingers Dr NE
- 5909 Coit Ave NE
- 2880 Fingers Dr NE
- 5981 Coit Ave NE
- 5905 Coit Ave NE
- 5925 Coit Ave NE
- 5901 Coit Ave NE
- 5897 Coit Ave NE
- 5954 Coit Ave NE
- 5023 Plainfield Ave NE