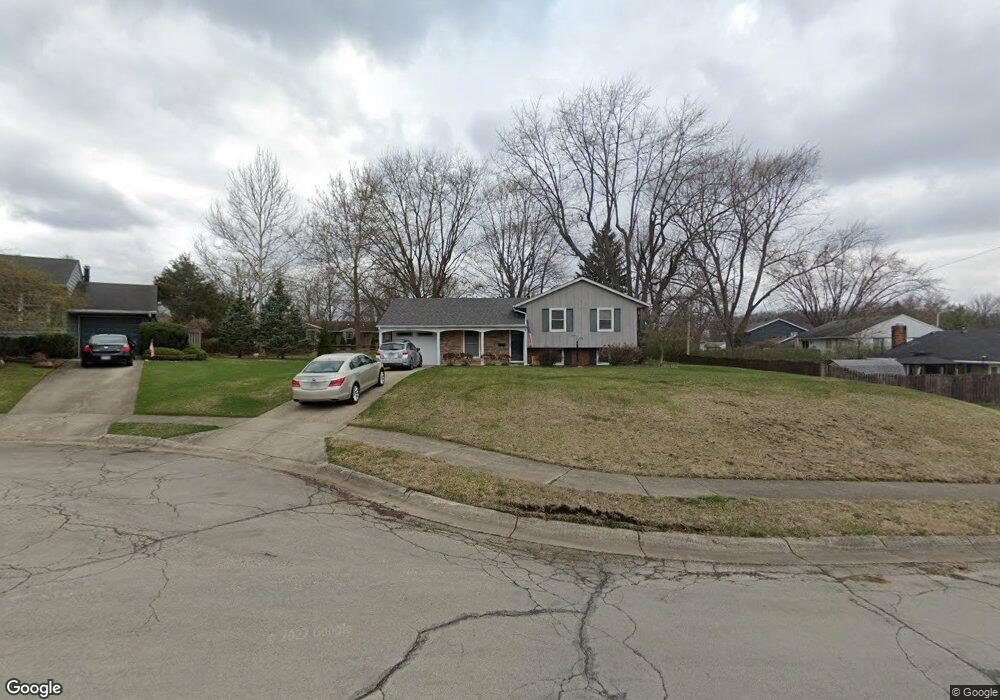
2917 Mystic Ln Springfield, OH 45503
Estimated Value: $202,000 - $216,000
3
Beds
2
Baths
1,378
Sq Ft
$151/Sq Ft
Est. Value
About This Home
This home is located at 2917 Mystic Ln, Springfield, OH 45503 and is currently estimated at $208,107, approximately $151 per square foot. 2917 Mystic Ln is a home located in Clark County with nearby schools including Kenton Elementary School, Roosevelt Middle School, and Springfield High School.
Ownership History
Date
Name
Owned For
Owner Type
Purchase Details
Closed on
Aug 15, 2015
Sold by
Ballard James
Bought by
Bragg Austin
Current Estimated Value
Home Financials for this Owner
Home Financials are based on the most recent Mortgage that was taken out on this home.
Original Mortgage
$95,366
Outstanding Balance
$75,005
Interest Rate
4.03%
Mortgage Type
New Conventional
Estimated Equity
$133,102
Purchase Details
Closed on
Dec 23, 2004
Sold by
Dobbins David F and Dobbins Barbara J
Bought by
Ballard James
Home Financials for this Owner
Home Financials are based on the most recent Mortgage that was taken out on this home.
Original Mortgage
$86,400
Interest Rate
7.37%
Mortgage Type
Purchase Money Mortgage
Purchase Details
Closed on
May 2, 1996
Sold by
Ziegler Victoria E
Bought by
Dobbins David F and Dobbins Barbara
Home Financials for this Owner
Home Financials are based on the most recent Mortgage that was taken out on this home.
Original Mortgage
$61,500
Interest Rate
7.86%
Mortgage Type
New Conventional
Create a Home Valuation Report for This Property
The Home Valuation Report is an in-depth analysis detailing your home's value as well as a comparison with similar homes in the area
Home Values in the Area
Average Home Value in this Area
Purchase History
| Date | Buyer | Sale Price | Title Company |
|---|---|---|---|
| Bragg Austin | $96,000 | Attorney | |
| Ballard James | $108,000 | -- | |
| Dobbins David F | $81,500 | -- |
Source: Public Records
Mortgage History
| Date | Status | Borrower | Loan Amount |
|---|---|---|---|
| Open | Bragg Austin | $95,366 | |
| Previous Owner | Ballard James | $86,400 | |
| Previous Owner | Dobbins David F | $61,500 | |
| Closed | Ballard James | $21,600 |
Source: Public Records
Tax History Compared to Growth
Tax History
| Year | Tax Paid | Tax Assessment Tax Assessment Total Assessment is a certain percentage of the fair market value that is determined by local assessors to be the total taxable value of land and additions on the property. | Land | Improvement |
|---|---|---|---|---|
| 2024 | $2,197 | $45,590 | $12,180 | $33,410 |
| 2023 | $2,197 | $45,590 | $12,180 | $33,410 |
| 2022 | $2,251 | $45,590 | $12,180 | $33,410 |
| 2021 | $1,955 | $36,570 | $9,160 | $27,410 |
| 2020 | $1,960 | $36,570 | $9,160 | $27,410 |
| 2019 | $1,965 | $36,570 | $9,160 | $27,410 |
| 2018 | $1,818 | $32,500 | $9,710 | $22,790 |
| 2017 | $1,816 | $34,595 | $9,706 | $24,889 |
| 2016 | $1,819 | $34,595 | $9,706 | $24,889 |
| 2015 | $1,975 | $34,045 | $9,156 | $24,889 |
| 2014 | $1,966 | $34,045 | $9,156 | $24,889 |
| 2013 | $1,945 | $34,045 | $9,156 | $24,889 |
Source: Public Records
Map
Nearby Homes
- 2907 Mystic Ln
- 3129 Haverhill St
- 1506 Hyannis Dr
- 1939 Providence Ave
- 1811 Devon Dr
- 1438 Ronald Rd
- 3214 Revels St
- 1732 Falmouth Ave
- 3307 Tackett St
- 3231 Vineyard St
- 2541 Derr Rd
- 1225 Vester Ave
- 2022 Westboro Ave
- 2683 Home Orchard Dr
- 2933 Bahia Dr
- 3316 Sudbury St
- 1001 Imperial Blvd
- 3032 Armsgate Rd Unit 25
- 2933 Stonehaven Dr
- 2340 E Home Rd
- 1813 Marinette Dr
- 1809 Marinette Dr
- 2926 Nauset St
- 2910 Nauset St
- 1805 Marinette Dr
- 2908 Mystic Ln
- 2900 Nauset St
- 1817 Marinette Dr
- 2916 Mystic Ln
- 2934 Haverhill St
- 2824 Nauset St
- 2912 Mystic Ln
- 1827 Marinette Dr
- 2941 Haverhill St
- 1820 Marinette Dr
- 1741 Marinette Dr
- 2919 Nauset St
- 2925 Nauset St
- 2909 Nauset St
- 2938 Haverhill St