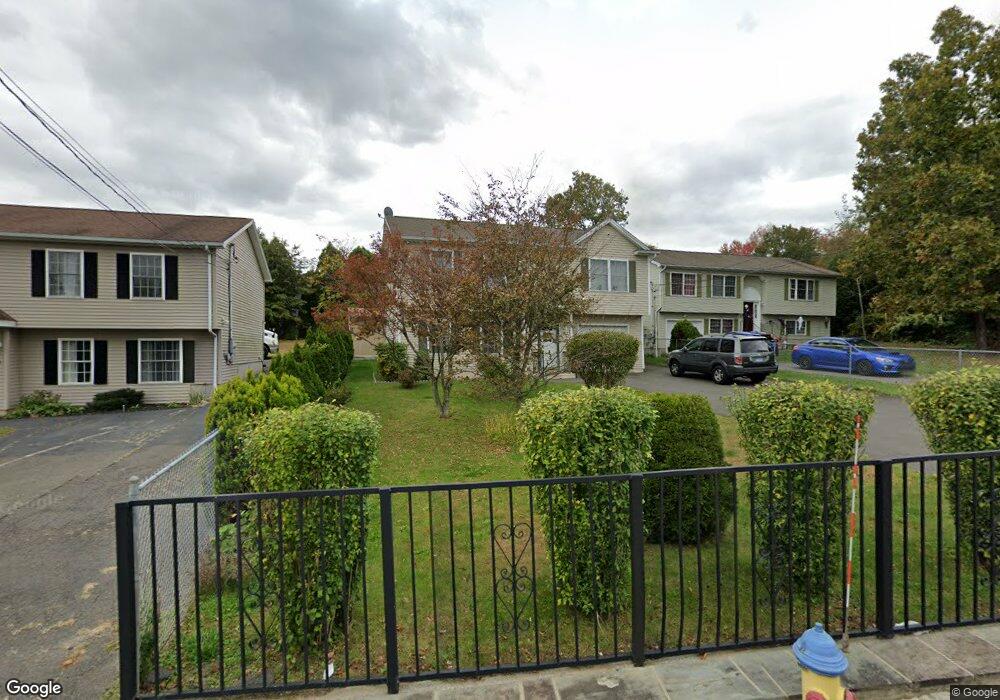
2917 N Main St Waterbury, CT 06704
Bucks Hill NeighborhoodEstimated Value: $309,000 - $360,000
3
Beds
2
Baths
972
Sq Ft
$338/Sq Ft
Est. Value
About This Home
This home is located at 2917 N Main St, Waterbury, CT 06704 and is currently estimated at $328,851, approximately $338 per square foot. 2917 N Main St is a home located in New Haven County with nearby schools including Regan Elementary School, North End Middle School, and Wilby High School.
Ownership History
Date
Name
Owned For
Owner Type
Purchase Details
Closed on
Aug 2, 2022
Sold by
Rodriguez Luz N and Calderon Sandra E
Bought by
Rodriguez Luz N
Current Estimated Value
Purchase Details
Closed on
Aug 26, 2013
Sold by
Rodriguez Victor and Rodriguez Crucita
Bought by
Rodriguez Luz N and Calderon Sandra F
Purchase Details
Closed on
May 27, 2000
Sold by
Foschini Anthony and Foschini Lisa M
Bought by
Conway Kathryn A
Home Financials for this Owner
Home Financials are based on the most recent Mortgage that was taken out on this home.
Original Mortgage
$118,900
Interest Rate
8.1%
Mortgage Type
Purchase Money Mortgage
Purchase Details
Closed on
Mar 14, 2000
Sold by
Onofreo Robert A and Deleo Steven H
Bought by
Rodriguez Victor and Rodriguez Crucita
Home Financials for this Owner
Home Financials are based on the most recent Mortgage that was taken out on this home.
Original Mortgage
$35,900
Interest Rate
8.18%
Mortgage Type
Purchase Money Mortgage
Create a Home Valuation Report for This Property
The Home Valuation Report is an in-depth analysis detailing your home's value as well as a comparison with similar homes in the area
Home Values in the Area
Average Home Value in this Area
Purchase History
| Date | Buyer | Sale Price | Title Company |
|---|---|---|---|
| Rodriguez Luz N | -- | None Available | |
| Rodriguez Luz N | -- | -- | |
| Conway Kathryn A | $119,900 | -- | |
| Rodriguez Victor | $105,000 | -- |
Source: Public Records
Mortgage History
| Date | Status | Borrower | Loan Amount |
|---|---|---|---|
| Previous Owner | Rodriguez Victor | $118,900 | |
| Previous Owner | Rodriguez Victor | $35,900 |
Source: Public Records
Tax History Compared to Growth
Tax History
| Year | Tax Paid | Tax Assessment Tax Assessment Total Assessment is a certain percentage of the fair market value that is determined by local assessors to be the total taxable value of land and additions on the property. | Land | Improvement |
|---|---|---|---|---|
| 2025 | $7,531 | $167,440 | $18,200 | $149,240 |
| 2024 | $8,278 | $167,440 | $18,200 | $149,240 |
| 2023 | $9,074 | $167,440 | $18,200 | $149,240 |
| 2022 | $4,772 | $79,250 | $18,200 | $61,050 |
| 2021 | $4,772 | $79,250 | $18,200 | $61,050 |
| 2020 | $4,772 | $79,250 | $18,200 | $61,050 |
| 2019 | $4,772 | $79,250 | $18,200 | $61,050 |
| 2018 | $4,772 | $79,250 | $18,200 | $61,050 |
| 2017 | $5,472 | $90,890 | $18,200 | $72,690 |
| 2016 | $5,472 | $90,890 | $18,200 | $72,690 |
| 2015 | $5,292 | $90,890 | $18,200 | $72,690 |
| 2014 | $5,292 | $90,890 | $18,200 | $72,690 |
Source: Public Records
Map
Nearby Homes
- 223 Bucks Hill Rd
- 64 Deerwood Ln Unit 2
- 0 Montoe Rd
- 245 Montoe Rd
- 0 Rd Unit 24092160
- 168 Lincolndale Dr
- 0 Goff St
- 2603 N Main St
- 440 Chestnut Hill Ave
- 474 Chestnut Hill Ave
- 8 Hayfield Rd
- 24 Holiday Hill
- 115 Cooper Dr
- 241 Judith Ln Unit 2
- 92 Holiday Hill
- 0 Spindle Hill Rd Unit 24062265
- 20 Society Hill Rd
- 24 Yorktown Ridge
- 58 Steep Hill Rd
- 79 Fieldstone Rd
- 2905 N Main St
- 2909 N Main St
- 2925 N Main St
- 13 Montoe Rd
- 00 Montoe Rd
- 2940 N Main St
- 2933 N Main St
- 16 Lisa Ct Unit 8
- 16 Lisa Ct Unit 6
- 16 Lisa Ct Unit 5
- 16 Lisa Ct Unit 4
- 16 Lisa Ct Unit 3
- 16 Lisa Ct Unit 2
- 16 Lisa Ct Unit 10
- 16 Lisa Ct Unit 1
- 16 Lisa Ct Unit 1-1
- 29 Montoe Rd
- 934 Boyden Street Extension
- 2889 N Main St
- 935 Boyden Street Extension