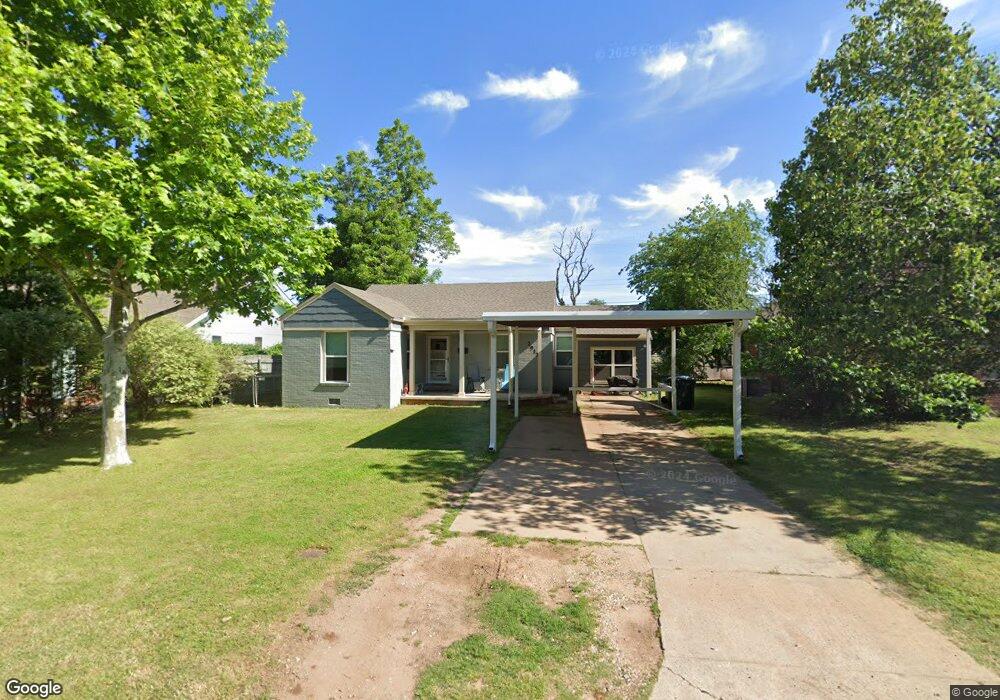
2917 NW 19th St Oklahoma City, OK 73107
Milam Place NeighborhoodEstimated Value: $133,000 - $160,000
2
Beds
1
Bath
938
Sq Ft
$158/Sq Ft
Est. Value
About This Home
This home is located at 2917 NW 19th St, Oklahoma City, OK 73107 and is currently estimated at $147,807, approximately $157 per square foot. 2917 NW 19th St is a home located in Oklahoma County with nearby schools including Kaiser Elementary School, Taft Middle School, and Northwest Classen High School.
Ownership History
Date
Name
Owned For
Owner Type
Purchase Details
Closed on
Jun 30, 2021
Sold by
Sanchez Lora Lee
Bought by
Hrscocks Shawn Christopher
Current Estimated Value
Purchase Details
Closed on
Jul 30, 2004
Sold by
Hedgecock Brenda C and Hedgecock Terry
Bought by
Sanchez Lora
Home Financials for this Owner
Home Financials are based on the most recent Mortgage that was taken out on this home.
Original Mortgage
$50,000
Interest Rate
6.3%
Mortgage Type
Purchase Money Mortgage
Purchase Details
Closed on
Feb 1, 2002
Sold by
Wright Eugene E
Bought by
Wright Eugene E and Hedgecock Brenda C
Purchase Details
Closed on
Aug 15, 2001
Sold by
Gurley Jimmy Gerald and Gurley Lila Darlene
Bought by
Gurley Jimmy Gerald and Gurley Lila Darlene
Purchase Details
Closed on
Feb 21, 2001
Sold by
Wright Beverly S and Wright Eugene E
Bought by
Wright Eugene E and Whited Wright Beverly S
Purchase Details
Closed on
Oct 13, 2000
Sold by
Wood Beverly S and Wright Beverly Sue
Bought by
Wright Eugene E and Wright Beverly Sue
Create a Home Valuation Report for This Property
The Home Valuation Report is an in-depth analysis detailing your home's value as well as a comparison with similar homes in the area
Home Values in the Area
Average Home Value in this Area
Purchase History
| Date | Buyer | Sale Price | Title Company |
|---|---|---|---|
| Hrscocks Shawn Christopher | -- | None Available | |
| Sanchez Lora | $50,000 | Elite Title & Escrow Associa | |
| Wright Eugene E | -- | -- | |
| Gurley Jimmy Gerald | -- | -- | |
| Wright Eugene E | -- | -- | |
| Wright Eugene E | -- | -- |
Source: Public Records
Mortgage History
| Date | Status | Borrower | Loan Amount |
|---|---|---|---|
| Previous Owner | Sanchez Lora | $50,000 |
Source: Public Records
Tax History Compared to Growth
Tax History
| Year | Tax Paid | Tax Assessment Tax Assessment Total Assessment is a certain percentage of the fair market value that is determined by local assessors to be the total taxable value of land and additions on the property. | Land | Improvement |
|---|---|---|---|---|
| 2024 | $1,229 | $10,507 | $1,875 | $8,632 |
| 2023 | $1,229 | $10,007 | $2,098 | $7,909 |
| 2022 | $1,121 | $9,530 | $2,079 | $7,451 |
| 2021 | $1,068 | $9,077 | $2,355 | $6,722 |
| 2020 | $1,029 | $8,645 | $1,595 | $7,050 |
| 2019 | $980 | $8,233 | $1,634 | $6,599 |
| 2018 | $889 | $7,841 | $0 | $0 |
| 2017 | $846 | $7,467 | $1,636 | $5,831 |
| 2016 | $807 | $7,111 | $1,629 | $5,482 |
| 2015 | $776 | $6,773 | $1,676 | $5,097 |
| 2014 | $774 | $6,799 | $1,676 | $5,123 |
Source: Public Records
Map
Nearby Homes
- 2822 NW 19th St
- 2854 NW 19th St
- 2841 NW 20th St
- 2208 N Brookline Ave
- 2809 NW 21st St
- 3104 NW 21st St
- 2765 NW 20th St
- 2939 NW 15th St
- 3105 NW 22nd St
- 2934 NW 15th St
- 2748 NW 22nd St
- 2749 NW 22nd St
- 3013 NW 24th St
- 1521 N Drexel Blvd
- 3117 NW 23rd St
- 3216 NW 19th St
- 2938 NW 14th St
- 3132 NW 16th St
- 1605 N Miller Blvd
- 2558 NW 21st St
- 2915 NW 19th St
- 2923 NW 19th St
- 2914 NW 20th St
- 2918 NW 20th St
- 2927 NW 19th St
- 2912 NW 20th St
- 2909 NW 19th St
- 2910 NW 20th St
- 2922 NW 20th St
- 2929 NW 19th St
- 2907 NW 19th St
- 2908 NW 20th St
- 2905 NW 19th St
- 2926 NW 20th St
- 2904 NW 20th St
- 2931 NW 19th St
- 2930 NW 20th St
- 2901 NW 19th St
- 2920 NW 19th St
- 2924 NW 19th St