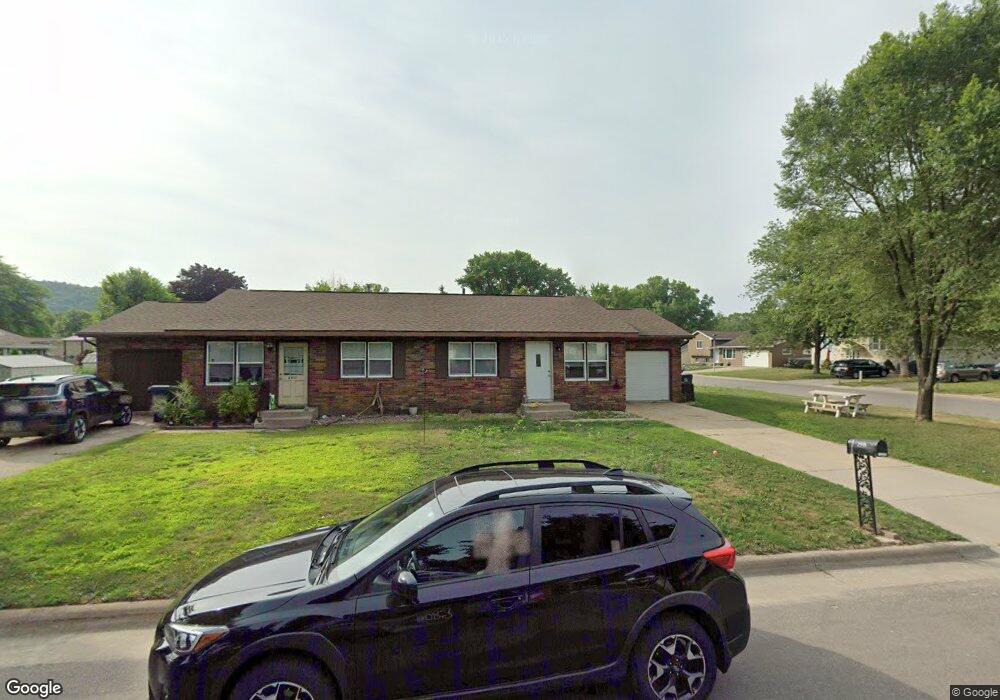
2917 S Marion Rd La Crosse, WI 54601
Estimated Value: $271,496 - $300,000
4
Beds
2
Baths
1,536
Sq Ft
$188/Sq Ft
Est. Value
About This Home
This home is located at 2917 S Marion Rd, La Crosse, WI 54601 and is currently estimated at $288,874, approximately $188 per square foot. 2917 S Marion Rd is a home located in La Crosse County with nearby schools including Southern Bluffs Elementary School, Longfellow Middle School, and Central High School.
Ownership History
Date
Name
Owned For
Owner Type
Purchase Details
Closed on
Apr 20, 2021
Sold by
Pe Rentals Llc
Bought by
Amnb Llc
Current Estimated Value
Home Financials for this Owner
Home Financials are based on the most recent Mortgage that was taken out on this home.
Original Mortgage
$172,000
Outstanding Balance
$155,543
Interest Rate
3.1%
Mortgage Type
New Conventional
Estimated Equity
$133,331
Purchase Details
Closed on
Sep 17, 2018
Sold by
Schock Rental Properties Llc
Bought by
Pe Rentals Llc
Home Financials for this Owner
Home Financials are based on the most recent Mortgage that was taken out on this home.
Original Mortgage
$133,711
Interest Rate
4.5%
Mortgage Type
New Conventional
Purchase Details
Closed on
May 2, 2014
Sold by
Schock Susan K
Bought by
Schock Rental Properties Llc
Purchase Details
Closed on
Sep 29, 2011
Sold by
Schock Arden M
Bought by
Schock Susan K
Create a Home Valuation Report for This Property
The Home Valuation Report is an in-depth analysis detailing your home's value as well as a comparison with similar homes in the area
Home Values in the Area
Average Home Value in this Area
Purchase History
| Date | Buyer | Sale Price | Title Company |
|---|---|---|---|
| Amnb Llc | $215,000 | New Castle Title | |
| Pe Rentals Llc | $132,000 | New Castle Title | |
| Schock Rental Properties Llc | -- | None Available | |
| Schock Susan K | -- | None Available |
Source: Public Records
Mortgage History
| Date | Status | Borrower | Loan Amount |
|---|---|---|---|
| Open | Amnb Llc | $172,000 | |
| Previous Owner | Pe Rentals Llc | $133,711 |
Source: Public Records
Tax History Compared to Growth
Tax History
| Year | Tax Paid | Tax Assessment Tax Assessment Total Assessment is a certain percentage of the fair market value that is determined by local assessors to be the total taxable value of land and additions on the property. | Land | Improvement |
|---|---|---|---|---|
| 2023 | $4,270 | $210,300 | $23,200 | $187,100 |
| 2022 | $4,052 | $210,300 | $23,200 | $187,100 |
| 2021 | $4,151 | $162,100 | $23,200 | $138,900 |
| 2020 | $4,080 | $162,100 | $23,200 | $138,900 |
| 2019 | $4,080 | $162,100 | $23,200 | $138,900 |
| 2018 | $3,748 | $131,200 | $21,000 | $110,200 |
| 2015 | $3,741 | $131,200 | $21,000 | $110,200 |
Source: Public Records
Map
Nearby Homes
- 2919 Robin Hood Dr
- 2956 S Marion Rd
- 3010 N Marion Rd
- 2729 Oak Dr
- 3013 Lakota Place
- 0000 Mormon Coulee Rd
- 4625 Mormon Coulee Rd
- 4127 Kammel Rd
- 4430 Mormon Coulee Rd
- 4605 Juniper St
- 3532 Levy Ln
- 4145 Fairway St
- 5221 33rd St S
- 2933 Birch St
- 5521 Mormon Coulee Rd
- 3540 East Ave S Unit B
- 3314 27th St S
- 3439 East Ave S
- 3170 27th St S
- 5917 River Run Rd
- 2935 S Marion Rd
- 2907 S Marion Rd
- 2910 Robin Hood Dr
- 2941 S Marion Rd
- 2904 S Marion Rd
- 2938 S Marion Rd
- 2934 S Marion Rd
- 2928 S Marion Rd
- 2942 S Marion Rd
- 2922 S Marion Rd
- 2914 S Marion Rd
- 2918 Robin Hood Dr
- 2948 S Marion Rd
- 2949 S Marion Rd
- 2830 Robin Hood Dr
- 2906 N Marion Rd
- 2924 Robin Hood Dr
- 2907 Scarlett Dr
- 2907 N Marion Rd
- 2915 Scarlett Dr