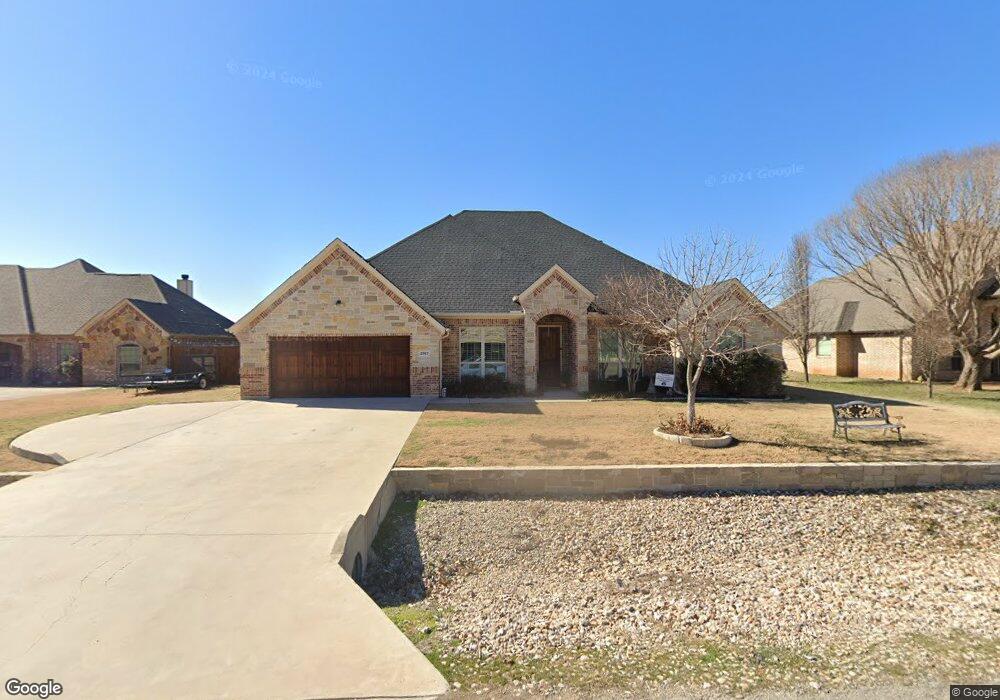
2917 Willow Ridge Cir Granbury, TX 76049
Estimated Value: $422,000 - $469,000
--
Bed
--
Bath
2,388
Sq Ft
$187/Sq Ft
Est. Value
About This Home
This home is located at 2917 Willow Ridge Cir, Granbury, TX 76049 and is currently estimated at $446,363, approximately $186 per square foot. 2917 Willow Ridge Cir is a home with nearby schools including Acton Elementary School, Acton Middle School, and Granbury High School.
Ownership History
Date
Name
Owned For
Owner Type
Purchase Details
Closed on
Aug 7, 2017
Sold by
Hinsley Jennifer and Hinsley Michael
Bought by
Richman Adam and Richman Alicia
Current Estimated Value
Home Financials for this Owner
Home Financials are based on the most recent Mortgage that was taken out on this home.
Original Mortgage
$213,400
Outstanding Balance
$177,640
Interest Rate
3.96%
Mortgage Type
New Conventional
Estimated Equity
$268,723
Purchase Details
Closed on
Oct 5, 2015
Sold by
Tri-County Development Inc
Bought by
Hinsley Jennifer and Hinsley Michael
Home Financials for this Owner
Home Financials are based on the most recent Mortgage that was taken out on this home.
Original Mortgage
$215,622
Interest Rate
3.85%
Mortgage Type
New Conventional
Purchase Details
Closed on
Jan 21, 2005
Sold by
Tri-County Development Inc
Bought by
Hinsley Jennifer Etvir Michael
Create a Home Valuation Report for This Property
The Home Valuation Report is an in-depth analysis detailing your home's value as well as a comparison with similar homes in the area
Home Values in the Area
Average Home Value in this Area
Purchase History
| Date | Buyer | Sale Price | Title Company |
|---|---|---|---|
| Richman Adam | -- | Porter Title Company | |
| Hinsley Jennifer | -- | Stonewall Title Company | |
| Hinsley Jennifer Etvir Michael | -- | -- |
Source: Public Records
Mortgage History
| Date | Status | Borrower | Loan Amount |
|---|---|---|---|
| Open | Richman Adam | $213,400 | |
| Previous Owner | Hinsley Jennifer | $215,622 |
Source: Public Records
Tax History Compared to Growth
Tax History
| Year | Tax Paid | Tax Assessment Tax Assessment Total Assessment is a certain percentage of the fair market value that is determined by local assessors to be the total taxable value of land and additions on the property. | Land | Improvement |
|---|---|---|---|---|
| 2025 | $4,236 | $448,099 | $40,000 | $420,930 |
| 2024 | $3,922 | $407,363 | $40,000 | $425,500 |
| 2023 | $3,928 | $474,650 | $40,000 | $434,650 |
| 2022 | $4,079 | $426,250 | $30,000 | $396,250 |
| 2021 | $4,699 | $306,060 | $30,000 | $276,060 |
| 2020 | $4,539 | $292,300 | $30,000 | $262,300 |
| 2019 | $4,752 | $292,300 | $30,000 | $262,300 |
| 2018 | $4,337 | $266,790 | $30,000 | $236,790 |
| 2017 | $4,389 | $262,490 | $30,000 | $232,490 |
| 2016 | $4,171 | $249,440 | $30,000 | $219,440 |
| 2015 | $249 | $15,000 | $15,000 | $0 |
| 2014 | $249 | $15,000 | $15,000 | $0 |
Source: Public Records
Map
Nearby Homes
- 2925 Willow Ridge Cir
- 2936 Willow Ridge Cir
- 1141 Avery Rd
- 1144 Avery Rd
- 1136 Avery Rd
- 2918 James Rd
- 4920 Centre Ct
- 3218 Fountain Way
- 3510 Fountain Way
- 4363 Acton Hwy
- 4512 Cimmaron Trail
- 5003 Bueno Dr
- 4410 Halo Ct
- 3207 Hummingbird Ct
- 1301 James Rd
- 2180 James Rd
- 2445 Bob White Dr
- 3707 Bob White Dr
- 2608 Royal Ln
- 5102 Largo Dr
- 2919 Willow Ridge Cir
- 2915 Willow Ridge Cir
- 2831 Willow Ridge Cir
- 2829 Willow Ridge Cir
- 2833 Willow Ridge Cir
- 2921 Willow Ridge Cir
- 2913 Willow Ridge Cir
- 2916 Willow Ridge Cir
- 2827 Willow Ridge Cir
- 2914 Willow Ridge Cir
- 2918 Willow Ridge Cir
- 2901 Willow Ridge Cir
- 2920 Willow Ridge Cir
- 2923 Willow Ridge Cir
- 2912 Willow Ridge Cir
- 2825 Willow Ridge Cir
- 2922 Willow Ridge Cir
- 2832 Willow Ridge Cir
- 2834 Willow Ridge Cir
- 2830 Willow Ridge Cir