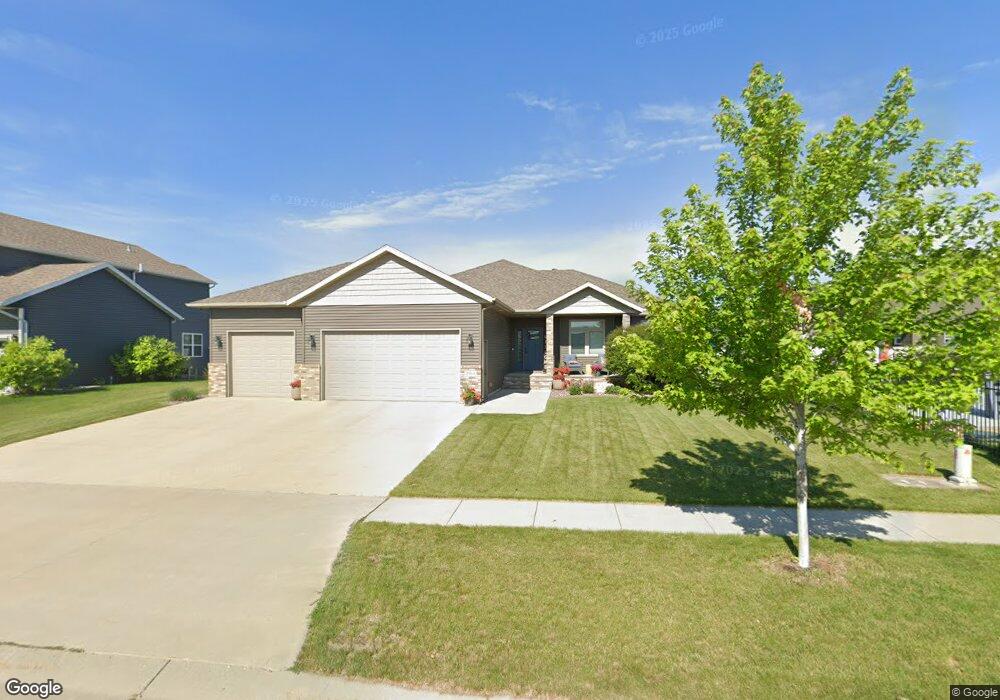
2918 7th St E West Fargo, ND 58078
The Preserve NeighborhoodEstimated Value: $540,000
5
Beds
2
Baths
1,760
Sq Ft
$307/Sq Ft
Est. Value
About This Home
This home is located at 2918 7th St E, West Fargo, ND 58078 and is currently estimated at $540,000, approximately $306 per square foot. 2918 7th St E is a home with nearby schools including Freedom Elementary School, Liberty Middle School, and West Fargo Sheyenne High School.
Ownership History
Date
Name
Owned For
Owner Type
Purchase Details
Closed on
Mar 4, 2013
Sold by
Bmw Homes Inc
Bought by
Davis Brad D and Davis Debra L
Current Estimated Value
Home Financials for this Owner
Home Financials are based on the most recent Mortgage that was taken out on this home.
Original Mortgage
$246,400
Outstanding Balance
$172,294
Interest Rate
3.34%
Mortgage Type
New Conventional
Estimated Equity
$367,706
Purchase Details
Closed on
Oct 1, 2012
Sold by
Rusty Goose Development Lllp
Bought by
Bmw Homes Inc
Create a Home Valuation Report for This Property
The Home Valuation Report is an in-depth analysis detailing your home's value as well as a comparison with similar homes in the area
Home Values in the Area
Average Home Value in this Area
Purchase History
| Date | Buyer | Sale Price | Title Company |
|---|---|---|---|
| Davis Brad D | -- | None Available | |
| Bmw Homes Inc | -- | None Available |
Source: Public Records
Mortgage History
| Date | Status | Borrower | Loan Amount |
|---|---|---|---|
| Open | Davis Brad D | $246,400 |
Source: Public Records
Tax History
| Year | Tax Paid | Tax Assessment Tax Assessment Total Assessment is a certain percentage of the fair market value that is determined by local assessors to be the total taxable value of land and additions on the property. | Land | Improvement |
|---|---|---|---|---|
| 2024 | $9,250 | $271,400 | $38,950 | $232,450 |
| 2023 | $9,463 | $257,500 | $38,950 | $218,550 |
| 2022 | $9,211 | $239,400 | $38,950 | $200,450 |
| 2021 | $8,881 | $221,650 | $31,150 | $190,500 |
| 2020 | $8,775 | $220,750 | $31,150 | $189,600 |
| 2019 | $8,599 | $211,000 | $31,150 | $179,850 |
| 2018 | $8,576 | $214,650 | $31,150 | $183,500 |
| 2017 | $8,449 | $214,650 | $31,150 | $183,500 |
| 2016 | $7,765 | $209,550 | $31,150 | $178,400 |
| 2015 | $5,534 | $104,450 | $23,450 | $81,000 |
| 2014 | $5,383 | $167,700 | $23,450 | $144,250 |
| 2013 | $7,491 | $167,700 | $23,450 | $144,250 |
Source: Public Records
Map
Nearby Homes
- 3137 6th St E
- 501 Foxtail Dr
- 445 E Foxtail Dr
- 433 Foxtail Dr
- 2432 Mcleod Dr E
- 3028 Ridge Dr E
- 503 33rd Way E Unit B
- 2858 Rivers Bend Dr E
- 522 34th Way E
- 2836 River's Bend Dr E
- 717 35th Ave E
- 267 34th Ave E
- 3371 1st St
- 3463 Loberg Dr
- 3479 Loberg Ln
- 3605 Houkom Dr E
- 3644 6th St E
- 1827 7th St E
- 1845 Huntington Ct
- 1836 12th St E
Your Personal Tour Guide
Ask me questions while you tour the home.