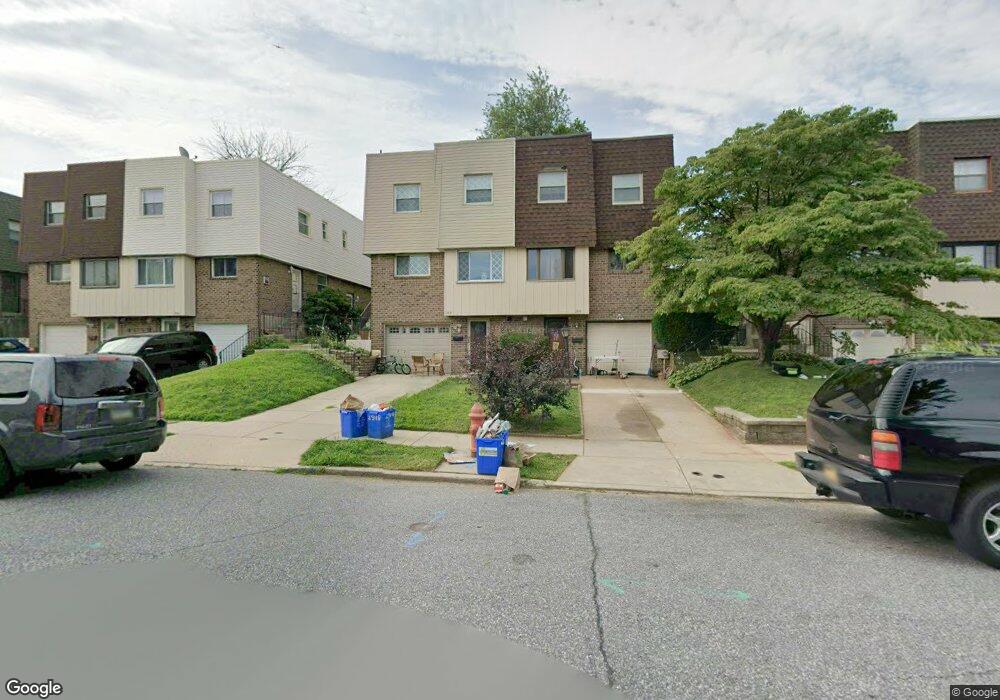
2918 Jenny Place Philadelphia, PA 19136
Pennypack NeighborhoodEstimated Value: $317,000 - $354,037
3
Beds
3
Baths
1,592
Sq Ft
$214/Sq Ft
Est. Value
About This Home
This home is located at 2918 Jenny Place, Philadelphia, PA 19136 and is currently estimated at $340,509, approximately $213 per square foot. 2918 Jenny Place is a home located in Philadelphia County with nearby schools including Lincoln High School, Robert B. Pollock School, and Meehan Austin Middle School.
Ownership History
Date
Name
Owned For
Owner Type
Purchase Details
Closed on
Nov 29, 2010
Sold by
U S Bank National Association
Bought by
Kodua Frank and Kodua Mary Odei
Current Estimated Value
Home Financials for this Owner
Home Financials are based on the most recent Mortgage that was taken out on this home.
Original Mortgage
$169,589
Outstanding Balance
$107,102
Interest Rate
3.37%
Mortgage Type
FHA
Estimated Equity
$233,407
Purchase Details
Closed on
Mar 29, 2010
Sold by
Glikman Roman
Bought by
Downey Savings & Loan Association Fa
Purchase Details
Closed on
Mar 2, 2006
Sold by
Glikman Boris and Glikman Svetlana
Bought by
Glikman Roman
Home Financials for this Owner
Home Financials are based on the most recent Mortgage that was taken out on this home.
Original Mortgage
$173,950
Interest Rate
7.14%
Mortgage Type
Purchase Money Mortgage
Purchase Details
Closed on
Jun 25, 1996
Sold by
Clarke Fred
Bought by
Glikman Boris and Glikman Svetlana
Create a Home Valuation Report for This Property
The Home Valuation Report is an in-depth analysis detailing your home's value as well as a comparison with similar homes in the area
Home Values in the Area
Average Home Value in this Area
Purchase History
| Date | Buyer | Sale Price | Title Company |
|---|---|---|---|
| Kodua Frank | $174,000 | None Available | |
| Downey Savings & Loan Association Fa | $120,000 | None Available | |
| Glikman Roman | $217,500 | None Available | |
| Glikman Boris | $98,400 | -- |
Source: Public Records
Mortgage History
| Date | Status | Borrower | Loan Amount |
|---|---|---|---|
| Open | Kodua Frank | $169,589 | |
| Previous Owner | Glikman Roman | $173,950 |
Source: Public Records
Tax History Compared to Growth
Tax History
| Year | Tax Paid | Tax Assessment Tax Assessment Total Assessment is a certain percentage of the fair market value that is determined by local assessors to be the total taxable value of land and additions on the property. | Land | Improvement |
|---|---|---|---|---|
| 2025 | $3,488 | $314,700 | $62,900 | $251,800 |
| 2024 | $3,488 | $314,700 | $62,900 | $251,800 |
| 2023 | $3,488 | $249,200 | $49,840 | $199,360 |
| 2022 | $2,858 | $204,200 | $49,840 | $154,360 |
| 2021 | $2,867 | $0 | $0 | $0 |
| 2020 | $2,867 | $0 | $0 | $0 |
| 2019 | $2,699 | $0 | $0 | $0 |
| 2018 | $2,640 | $0 | $0 | $0 |
| 2017 | $2,640 | $0 | $0 | $0 |
| 2016 | $2,220 | $0 | $0 | $0 |
| 2015 | $2,125 | $0 | $0 | $0 |
| 2014 | -- | $188,600 | $46,229 | $142,371 |
| 2012 | -- | $28,480 | $5,700 | $22,780 |
Source: Public Records
Map
Nearby Homes
- 2949 Joey Dr
- 4R & 6 Old Ashton Rd
- 8200 Colfax St
- 2876 Walnut Hill St
- 3100 Welsh Rd
- 8209 Albion St
- 2934 Walnut Hill St
- 2759 Axe Factory Rd
- 2817 Walnut Hill St Unit A
- 3165 Weston St
- 2740 Mower St
- 2738 Maxwell St
- 2831 Sebring Rd
- 2713 Clayton St
- 8027 Narvon St
- 2831 Chase Rd
- 3170 Weston St
- 8718 Hargrave St
- 2959 Tremont St
- 2711 Winchester Ave
- 2916 Jenny Place
- 2920 Jenny Place
- 2922 Jenny Place
- 2936 Jenny Place
- 2914 Jenny Place
- 2924 Jenny Place
- 2912 Jenny Place
- 2926 Jenny Place
- 2917 Jenny Place
- 2928 Jenny Place
- 2909 Jenny Place
- 2911 Jenny Place
- 2925 Jenny Place
- 2930 Jenny Place
- 8813 Ashton Rd
- 8815 Ashton Rd
- 2907 Jenny Place
- 8817 Ashton Rd
- 8926 Lewin Place
- 8789 Ashton Rd