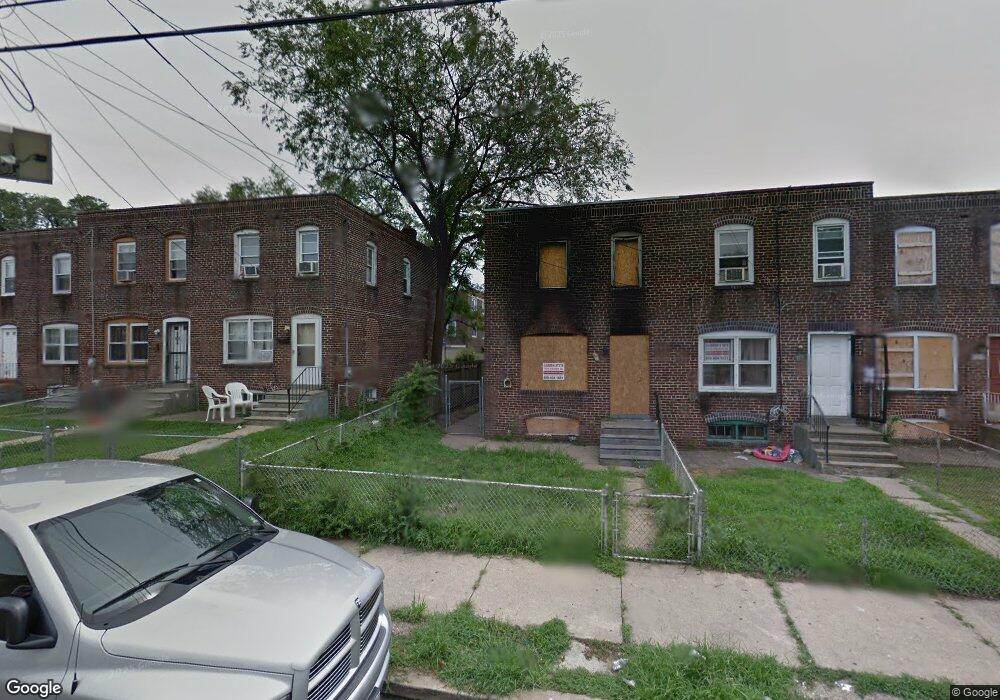
2918 Royden St Camden, NJ 08105
Stockton NeighborhoodEstimated Value: $138,302
3
Beds
2
Baths
1,024
Sq Ft
$135/Sq Ft
Est. Value
About This Home
This home is located at 2918 Royden St, Camden, NJ 08105 and is currently estimated at $138,302, approximately $135 per square foot. 2918 Royden St is a home located in Camden County with nearby schools including Eastside High School and St Joseph Pro-Cathedral School.
Ownership History
Date
Name
Owned For
Owner Type
Purchase Details
Closed on
Aug 13, 2021
Sold by
Federal Home Loan Mortgage Corporation
Bought by
City Of Camden
Current Estimated Value
Purchase Details
Closed on
Aug 12, 2019
Sold by
Alvarez Maria M and Newrez Llc
Bought by
Federal Home Loan Mortgage Corporation
Purchase Details
Closed on
Jun 3, 2005
Sold by
Cohen Jeramy
Bought by
Alvarez Maria
Home Financials for this Owner
Home Financials are based on the most recent Mortgage that was taken out on this home.
Original Mortgage
$70,300
Interest Rate
5.71%
Purchase Details
Closed on
Mar 14, 2005
Sold by
Feliciano Wilfred
Bought by
Cohen Jeramy
Purchase Details
Closed on
Jul 12, 1996
Sold by
Carrero Gloria
Bought by
Feliciano Wilfredo
Home Financials for this Owner
Home Financials are based on the most recent Mortgage that was taken out on this home.
Original Mortgage
$32,000
Interest Rate
8.37%
Mortgage Type
FHA
Create a Home Valuation Report for This Property
The Home Valuation Report is an in-depth analysis detailing your home's value as well as a comparison with similar homes in the area
Home Values in the Area
Average Home Value in this Area
Purchase History
| Date | Buyer | Sale Price | Title Company |
|---|---|---|---|
| City Of Camden | -- | None Listed On Document | |
| Federal Home Loan Mortgage Corporation | -- | None Available | |
| Alvarez Maria | $74,000 | -- | |
| Cohen Jeramy | $43,000 | -- | |
| Feliciano Wilfredo | $32,000 | -- |
Source: Public Records
Mortgage History
| Date | Status | Borrower | Loan Amount |
|---|---|---|---|
| Previous Owner | Alvarez Maria | $70,300 | |
| Previous Owner | Feliciano Wilfredo | $32,000 |
Source: Public Records
Tax History Compared to Growth
Tax History
| Year | Tax Paid | Tax Assessment Tax Assessment Total Assessment is a certain percentage of the fair market value that is determined by local assessors to be the total taxable value of land and additions on the property. | Land | Improvement |
|---|---|---|---|---|
| 2025 | $610 | $17,800 | $17,800 | -- |
| 2024 | $610 | $17,800 | $17,800 | $0 |
| 2023 | $610 | $17,800 | $17,800 | $0 |
| 2022 | $598 | $17,800 | $17,800 | $0 |
| 2021 | $596 | $17,800 | $17,800 | $0 |
| 2020 | $566 | $17,800 | $17,800 | $0 |
| 2019 | $542 | $17,800 | $17,800 | $0 |
| 2018 | $539 | $17,800 | $17,800 | $0 |
| 2017 | $526 | $17,800 | $17,800 | $0 |
| 2016 | $2,060 | $72,000 | $17,800 | $54,200 |
| 2015 | $1,983 | $72,000 | $17,800 | $54,200 |
| 2014 | $1,935 | $72,000 | $17,800 | $54,200 |
Source: Public Records
Map
Nearby Homes
- 2933 Royden St
- 402 S 30th St
- 3001 Royden St
- 355 S 27th St
- 363 Garden Ave
- 520 Beacon Ave
- 6861 Clark Ave
- 341 Marlton Ave
- 420 Boyd St
- 7130 Rosemont Ave
- 154 Eutaw Ave
- 555 Pfeiffer St
- 477 Rand St
- 3075 Stevens St
- 608 Raritan St
- 6887 Woodland Ave
- 7186 Waldorf Ave
- 506 Pfeiffer St
- 603 Raritan St
- 2937 Carman St