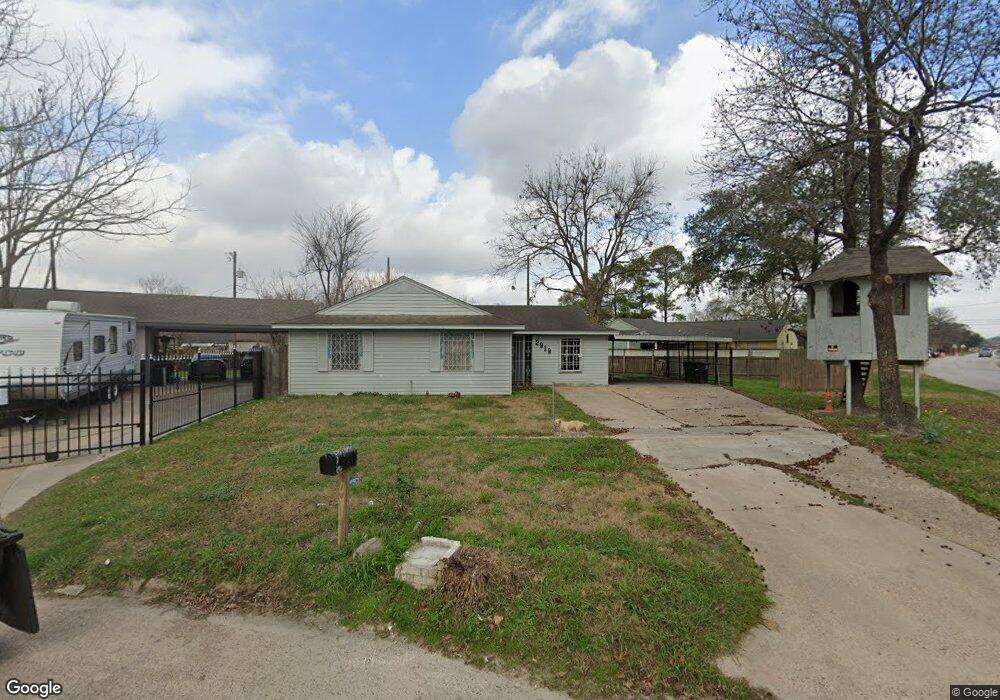
2919 Charter Oaks Dr Houston, TX 77093
Eastex-Jensen NeighborhoodEstimated Value: $158,069 - $177,000
3
Beds
1
Bath
1,218
Sq Ft
$139/Sq Ft
Est. Value
About This Home
This home is located at 2919 Charter Oaks Dr, Houston, TX 77093 and is currently estimated at $169,017, approximately $138 per square foot. 2919 Charter Oaks Dr is a home located in Harris County with nearby schools including Scarborough Elementary School, Patrick Henry Middle School, and Sam Houston Math, Science & Technology Center.
Ownership History
Date
Name
Owned For
Owner Type
Purchase Details
Closed on
Sep 20, 2024
Sold by
Sunset Investors Llc
Bought by
Paez Efrain
Current Estimated Value
Purchase Details
Closed on
Jun 21, 2017
Sold by
Carrington Mortgage Servicing Llc
Bought by
Sunset Investor Llc
Purchase Details
Closed on
May 12, 2017
Sold by
Guerrero Caritina
Bought by
Carrington Mortgage Services Llc
Purchase Details
Closed on
Sep 10, 2008
Sold by
Torres Ascencion and Torres Liliana
Bought by
Guerrero Caritina
Home Financials for this Owner
Home Financials are based on the most recent Mortgage that was taken out on this home.
Original Mortgage
$67,114
Interest Rate
6.46%
Mortgage Type
FHA
Create a Home Valuation Report for This Property
The Home Valuation Report is an in-depth analysis detailing your home's value as well as a comparison with similar homes in the area
Home Values in the Area
Average Home Value in this Area
Purchase History
| Date | Buyer | Sale Price | Title Company |
|---|---|---|---|
| Paez Efrain | -- | None Listed On Document | |
| Sunset Investor Llc | $60,000 | Carrington Title Svcs Llc | |
| Carrington Mortgage Services Llc | $6,000 | None Available | |
| Gibson Maloolm D | -- | None Available | |
| Guerrero Caritina | -- | Etc |
Source: Public Records
Mortgage History
| Date | Status | Borrower | Loan Amount |
|---|---|---|---|
| Previous Owner | Guerrero Caritina | $67,114 |
Source: Public Records
Tax History Compared to Growth
Tax History
| Year | Tax Paid | Tax Assessment Tax Assessment Total Assessment is a certain percentage of the fair market value that is determined by local assessors to be the total taxable value of land and additions on the property. | Land | Improvement |
|---|---|---|---|---|
| 2025 | $2,901 | $148,025 | $53,235 | $94,790 |
| 2024 | $2,901 | $138,665 | $43,875 | $94,790 |
| 2023 | $2,901 | $139,322 | $43,875 | $95,447 |
| 2022 | $2,729 | $123,931 | $29,250 | $94,681 |
| 2021 | $2,300 | $98,673 | $19,013 | $79,660 |
| 2020 | $2,305 | $95,185 | $19,013 | $76,172 |
| 2019 | $2,266 | $89,563 | $16,088 | $73,475 |
| 2018 | $1,625 | $64,237 | $16,088 | $48,149 |
| 2017 | $1,624 | $64,237 | $16,088 | $48,149 |
| 2016 | $1,488 | $58,834 | $16,088 | $42,746 |
| 2015 | $1,747 | $58,834 | $16,088 | $42,746 |
| 2014 | $1,747 | $67,959 | $16,088 | $51,871 |
Source: Public Records
Map
Nearby Homes
- 1728 Little York Rd
- 1904 Little York Rd
- 2636 Lone Oak Rd
- 2629 Kowis St
- 2817 Cromwell St
- 3418 Hopper Rd
- 3214 Brea Crest St
- 2915 Brea Crest St
- 3804 Cedar Hill Ln
- 4918 Langley Rd
- 2311 Warwick Rd
- 2237 Cromwell St
- 2315 Langley Rd
- 2152 William Tell St
- 3111 Hartwick Rd
- 11716 Innsbury Dr
- 2122 Kowis St
- 2326 Sunny Dr
- 2306 Wardmont St
- 2332 Margaret St
- 2915 Charter Oaks Dr
- 2916 Sagebrush Dr
- 2912 Sagebrush Dr
- 2912 Charter Oaks Dr
- 2908 Sagebrush Dr
- 3003 Charter Oaks Dr
- 3004 Sagebrush Dr
- 10940 Royal Pine Dr
- 10932 Royal Pine Dr
- 10936 Royal Pine Dr
- 2916 Charter Oaks Dr
- 10928 Royal Pine Dr
- 2920 Charter Oaks Dr
- 3008 Sagebrush Dr
- 3009 Charter Oaks Dr
- 10924 Royal Pine Dr
- 2919 Sagebrush Dr
- 2915 Sagebrush Dr
- 3003 Sagebrush Dr
- 3012 Sagebrush Dr