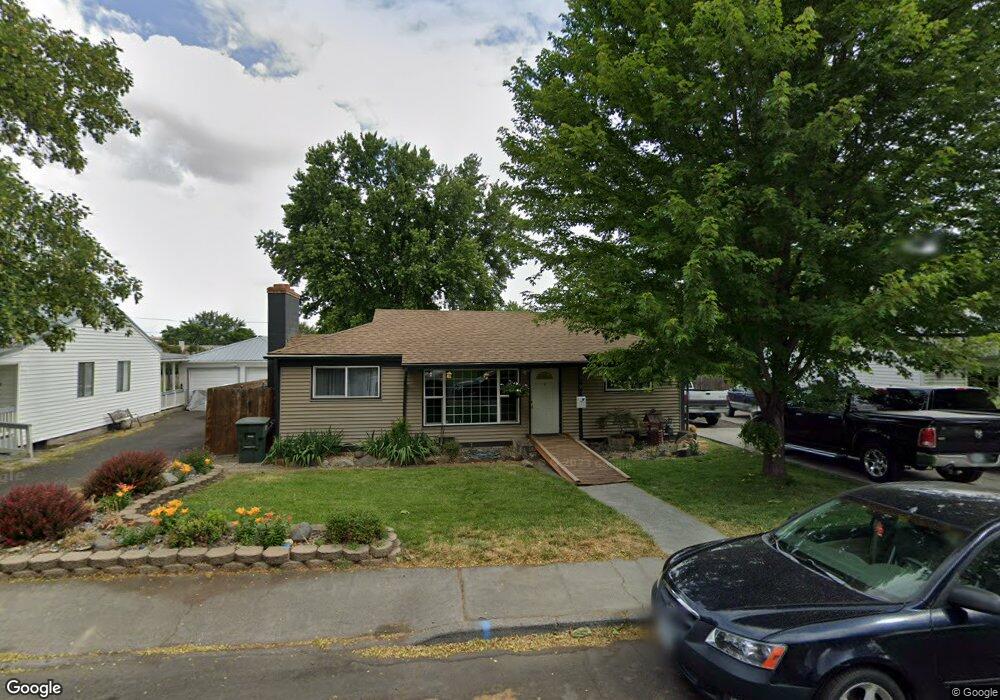
2919 SW Ladow Ave Pendleton, OR 97801
Estimated Value: $262,563 - $291,000
3
Beds
2
Baths
1,324
Sq Ft
$206/Sq Ft
Est. Value
About This Home
This home is located at 2919 SW Ladow Ave, Pendleton, OR 97801 and is currently estimated at $273,141, approximately $206 per square foot. 2919 SW Ladow Ave is a home located in Umatilla County with nearby schools including Sunridge Middle School, Pendleton High School, and Pendleton Christian School.
Ownership History
Date
Name
Owned For
Owner Type
Purchase Details
Closed on
Feb 23, 2017
Sold by
Underhill Carol
Bought by
Degeer Douglas W and Dernovek Tracy R
Current Estimated Value
Home Financials for this Owner
Home Financials are based on the most recent Mortgage that was taken out on this home.
Original Mortgage
$116,000
Outstanding Balance
$95,827
Interest Rate
4.12%
Mortgage Type
New Conventional
Estimated Equity
$177,314
Purchase Details
Closed on
Mar 15, 2016
Sold by
Flanagan Kathleen A
Bought by
Underhill Carol
Home Financials for this Owner
Home Financials are based on the most recent Mortgage that was taken out on this home.
Original Mortgage
$123,500
Interest Rate
3.72%
Mortgage Type
New Conventional
Purchase Details
Closed on
Aug 9, 2006
Sold by
Hall Brett R
Bought by
Flanagan Kathleen A
Home Financials for this Owner
Home Financials are based on the most recent Mortgage that was taken out on this home.
Original Mortgage
$103,800
Interest Rate
6.76%
Mortgage Type
New Conventional
Create a Home Valuation Report for This Property
The Home Valuation Report is an in-depth analysis detailing your home's value as well as a comparison with similar homes in the area
Home Values in the Area
Average Home Value in this Area
Purchase History
| Date | Buyer | Sale Price | Title Company |
|---|---|---|---|
| Degeer Douglas W | $145,000 | Amerititle | |
| Underhill Carol | $130,000 | Amerititle | |
| Flanagan Kathleen A | $90,000 | Amerititle |
Source: Public Records
Mortgage History
| Date | Status | Borrower | Loan Amount |
|---|---|---|---|
| Open | Degeer Douglas W | $116,000 | |
| Previous Owner | Underhill Carol | $123,500 | |
| Previous Owner | Flanagan Kathleen A | $103,800 |
Source: Public Records
Tax History
| Year | Tax Paid | Tax Assessment Tax Assessment Total Assessment is a certain percentage of the fair market value that is determined by local assessors to be the total taxable value of land and additions on the property. | Land | Improvement |
|---|---|---|---|---|
| 2022 | $2,164 | $119,640 | $0 | $0 |
| 2021 | $2,177 | $116,160 | $38,770 | $77,390 |
| 2020 | $2,102 | $112,780 | $37,640 | $75,140 |
| 2018 | $2,034 | $106,320 | $35,480 | $70,840 |
| 2017 | $1,957 | $103,230 | $34,450 | $68,780 |
| 2016 | $1,819 | $100,230 | $33,450 | $66,780 |
| 2015 | $1,826 | $91,740 | $30,610 | $61,130 |
| 2014 | $1,766 | $91,740 | $30,610 | $61,130 |
Source: Public Records
Map
Nearby Homes
- 3014 SW Kirk Ave
- 0 SW Ladow Ave Unit Lot 41
- 0 SW Ladow Ave Unit Lot 42
- 0 SW Ladow Ave Unit Lot 43
- 1004 SW 33rd St
- 3307 SW Kirk Ave
- 3218 SW Isaac Ave
- 0 SW 30th Unit 22542685
- 0 SW Kirk Ave Unit 200 21392184
- 0 SW Kirk Ave Unit 101 21527345
- 0 SW Kirk Ave Unit 5500 21002117
- 1206 SW 24th St
- 1414 SW 24th St
- 1437 SW 37th St Unit 43
- 2801 SW Houtama Rd
- 0 SW Quinney Ln Unit 24414661
- 4226 SW Kirk Ave
- 3033 SW Terrace Dr
- 814 SW 44th St
- 1901 SW Runnion Ln
- 2917 SW Ladow Ave
- 2923 SW Ladow Ave
- 2913 SW Ladow Ave
- 2927 SW Ladow Ave
- 3028 SW Kirk Ave
- 3022 SW Kirk Ave
- 3023 SW Kirk Ave
- 3036 SW Kirk Ave
- 3001 SW Ladow Ave
- 3018 SW Kirk Ave
- 2907 SW Ladow Ave
- 2918 SW Ladow Ave
- 2924 SW Ladow Ave
- 2912 SW Ladow Ave
- 3040 SW Kirk Ave
- 3005 SW Ladow Ave
- 2901 SW Ladow Ave
- 3010 SW Kirk Ave
- 3000 SW Ladow Ave
- 2906 SW Ladow Ave
Your Personal Tour Guide
Ask me questions while you tour the home.