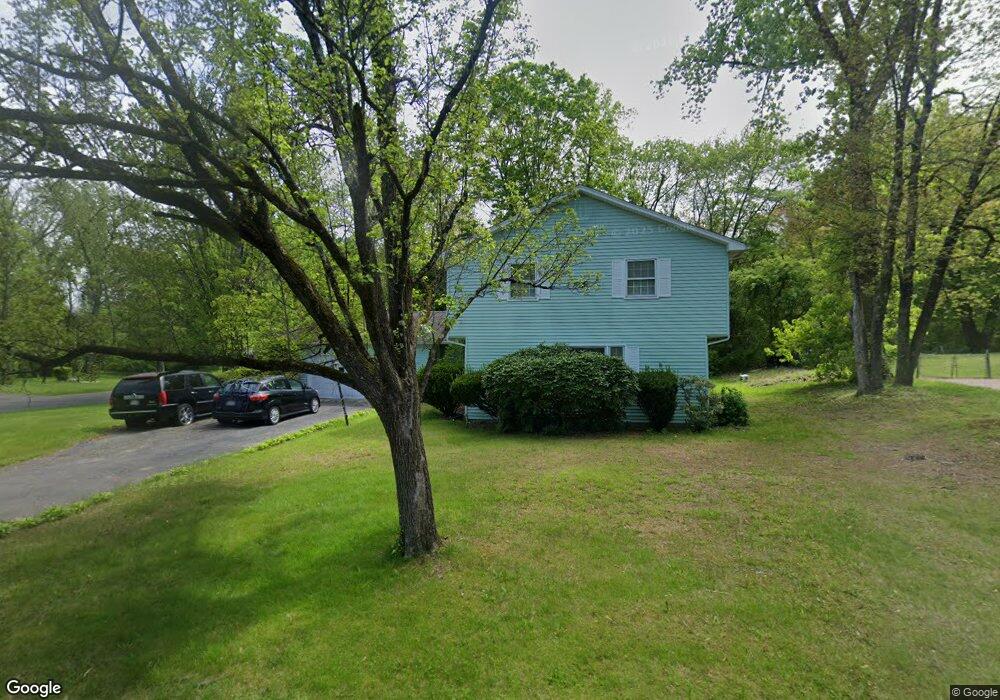
292 Belmont Ave West Springfield, MA 01089
Estimated Value: $452,000 - $495,000
4
Beds
3
Baths
2,468
Sq Ft
$191/Sq Ft
Est. Value
About This Home
This home is located at 292 Belmont Ave, West Springfield, MA 01089 and is currently estimated at $471,590, approximately $191 per square foot. 292 Belmont Ave is a home located in Hampden County with nearby schools including West Springfield High School and St Thomas The Apostle School.
Ownership History
Date
Name
Owned For
Owner Type
Purchase Details
Closed on
Aug 30, 2001
Sold by
Cote Raymond A and Cote Priscilla B
Bought by
Alli Deborah Y
Current Estimated Value
Home Financials for this Owner
Home Financials are based on the most recent Mortgage that was taken out on this home.
Original Mortgage
$140,250
Interest Rate
7.06%
Mortgage Type
Purchase Money Mortgage
Create a Home Valuation Report for This Property
The Home Valuation Report is an in-depth analysis detailing your home's value as well as a comparison with similar homes in the area
Home Values in the Area
Average Home Value in this Area
Purchase History
| Date | Buyer | Sale Price | Title Company |
|---|---|---|---|
| Alli Deborah Y | $165,000 | -- |
Source: Public Records
Mortgage History
| Date | Status | Borrower | Loan Amount |
|---|---|---|---|
| Open | Alli Deborah Y | $142,000 | |
| Closed | Alli Deborah Y | $140,250 | |
| Previous Owner | Alli Deborah Y | $63,300 |
Source: Public Records
Tax History Compared to Growth
Tax History
| Year | Tax Paid | Tax Assessment Tax Assessment Total Assessment is a certain percentage of the fair market value that is determined by local assessors to be the total taxable value of land and additions on the property. | Land | Improvement |
|---|---|---|---|---|
| 2025 | $5,353 | $360,000 | $130,500 | $229,500 |
| 2024 | $5,072 | $342,500 | $130,500 | $212,000 |
| 2023 | $4,898 | $315,200 | $130,500 | $184,700 |
| 2022 | $4,526 | $287,200 | $118,300 | $168,900 |
| 2021 | $4,522 | $267,600 | $111,400 | $156,200 |
| 2020 | $4,540 | $267,200 | $111,400 | $155,800 |
| 2019 | $4,532 | $267,200 | $111,400 | $155,800 |
| 2018 | $4,556 | $267,200 | $111,400 | $155,800 |
| 2017 | $4,556 | $267,200 | $111,400 | $155,800 |
| 2016 | $4,592 | $270,300 | $107,100 | $163,200 |
| 2015 | $4,501 | $264,900 | $104,900 | $160,000 |
| 2014 | $1,094 | $264,900 | $104,900 | $160,000 |
Source: Public Records
Map
Nearby Homes
- 117 Rogers Ave
- 69 Lancaster Ave
- 65 Verdugo St
- 43 Woodmont St
- 391 Rogers Ave
- 144 Ohio Ave
- 105 Meadowbrook Ave
- 51 Craiwell Ave
- 42 Janet St
- 77 Bowers St
- 12 Cedar Ave
- 132 Nelson St
- 103 Hillcrest Ave
- 36 Maple Terrace
- 22 Maple Terrace
- 258 Poplar Ave
- 45 Autumn Rd
- 264 Poplar Ave
- 236 Forest Glen
- 169 Chilson Rd
- 280 Belmont Ave
- 123 Belmont Ave
- 144 Belmont Ave
- 157 Belmont Ave
- 126 Belmont Ave
- 279 Belmont Ave
- 274 Belmont Ave
- 274 Belmont Ave
- 156 Belmont Ave
- 111 Belmont Ave
- 165 Belmont Ave
- 108 Belmont Ave
- 251 Belmont Ave
- 268 Belmont Ave
- 164 Belmont Ave
- 101 Belmont Ave
- 183 Belmont Ave
- 258 Belmont Ave
- 41 Plymouth Terrace
- 241 Belmont Ave