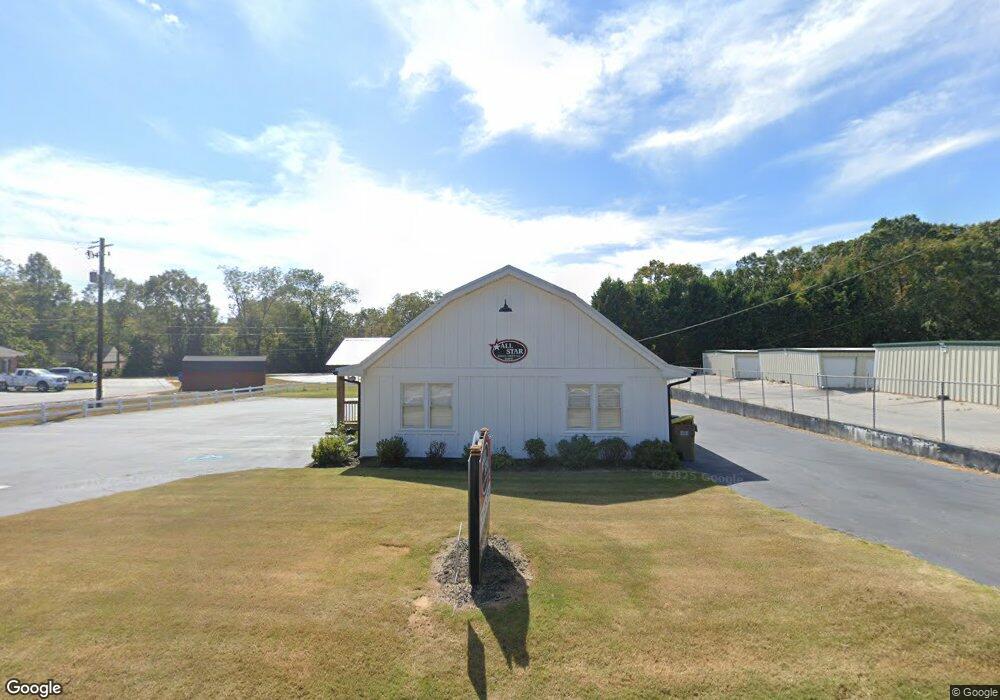
292 Highway 211 NW Winder, GA 30680
Estimated Value: $245,287
--
Bed
--
Bath
1,200
Sq Ft
$204/Sq Ft
Est. Value
About This Home
This home is located at 292 Highway 211 NW, Winder, GA 30680 and is currently estimated at $245,287, approximately $204 per square foot. 292 Highway 211 NW is a home located in Barrow County with nearby schools including County Line Elementary School, Russell Middle School, and Winder-Barrow High School.
Ownership History
Date
Name
Owned For
Owner Type
Purchase Details
Closed on
Apr 30, 2024
Sold by
Davila Cindy S
Bought by
Cindy Davila Llc
Current Estimated Value
Purchase Details
Closed on
Nov 15, 2023
Sold by
All Star Realty Group Llc
Bought by
Davila Cindy S and Melissa Etheridge Llc
Purchase Details
Closed on
Aug 30, 2018
Sold by
Manders Faye S
Bought by
All Star Realty Grp Llc
Home Financials for this Owner
Home Financials are based on the most recent Mortgage that was taken out on this home.
Original Mortgage
$75,000
Interest Rate
4.6%
Mortgage Type
New Conventional
Purchase Details
Closed on
Mar 29, 2013
Sold by
Jcg Svcs Inc
Bought by
Manders Faye S and Manders James E
Purchase Details
Closed on
May 25, 2012
Sold by
Manders Faye S
Bought by
Jcg Svcs Inc
Home Financials for this Owner
Home Financials are based on the most recent Mortgage that was taken out on this home.
Original Mortgage
$50,000
Interest Rate
3.88%
Mortgage Type
Commercial
Create a Home Valuation Report for This Property
The Home Valuation Report is an in-depth analysis detailing your home's value as well as a comparison with similar homes in the area
Home Values in the Area
Average Home Value in this Area
Purchase History
| Date | Buyer | Sale Price | Title Company |
|---|---|---|---|
| Cindy Davila Llc | -- | -- | |
| Cindy Davila Llc | -- | -- | |
| Davila Cindy S | $228,750 | -- | |
| All Star Realty Grp Llc | $175,000 | -- | |
| Manders Faye S | -- | -- | |
| Jcg Svcs Inc | $50,000 | -- |
Source: Public Records
Mortgage History
| Date | Status | Borrower | Loan Amount |
|---|---|---|---|
| Previous Owner | All Star Realty Grp Llc | $75,000 | |
| Previous Owner | Jcg Svcs Inc | $50,000 |
Source: Public Records
Tax History Compared to Growth
Tax History
| Year | Tax Paid | Tax Assessment Tax Assessment Total Assessment is a certain percentage of the fair market value that is determined by local assessors to be the total taxable value of land and additions on the property. | Land | Improvement |
|---|---|---|---|---|
| 2024 | $2,113 | $82,529 | $27,040 | $55,489 |
| 2023 | $2,154 | $82,529 | $27,040 | $55,489 |
| 2022 | $2,309 | $76,519 | $27,040 | $49,479 |
| 2021 | $1,778 | $55,831 | $24,000 | $31,831 |
| 2020 | $1,783 | $55,831 | $24,000 | $31,831 |
| 2019 | $1,814 | $55,831 | $24,000 | $31,831 |
| 2018 | $1,459 | $45,680 | $24,000 | $21,680 |
| 2017 | $1,298 | $44,590 | $24,000 | $20,590 |
| 2016 | $1,303 | $41,296 | $24,000 | $17,296 |
| 2015 | $1,309 | $41,296 | $24,000 | $17,296 |
| 2014 | $1,022 | $30,736 | $13,440 | $17,296 |
| 2013 | -- | $28,409 | $11,760 | $16,649 |
Source: Public Records
Map
Nearby Homes
- 24 Caison Dr
- 121 Cannondale Dr
- 108 Cannondale Dr
- 72 Garrison Dr
- 98 Cannondale Dr
- 66 Garrison Dr
- 62 Garrison Dr
- 49 Cannondale Dr
- 16 Garrison Dr
- 244 Bayou Ln Unit 1
- 74 Cannon Trace Dr
- 110 Mears St
- 221 Highway 211 NW
- 128 Mcneal Rd
- The Cary A Plan at Lake Shore
- The Marion A Plan at Lake Shore
- 0 Bill Rutledge Rd Unit 10591503
- 0 Bill Rutledge Rd Unit 7630436
- 281 Hillside Dr
- 281 Springdale Dr
- 299 Cedar Creek Rd
- 301 Cedar Creek Rd
- 301 Cedar Creek Rd Unit 7 D
- 301 Cedar Creek Rd Unit 7 B
- 289 Highway 211 NW
- 285 Georgia 211
- 140 Cedar Creek Rd
- 285 Highway 211 NW
- 0 Cedar Creek Rd Unit 7147203
- 0 Cedar Creek Rd Unit 3278093
- 0 Cedar Creek Rd Unit 8800879
- 0 Cedar Creek Rd Unit 8594734
- 0 Cedar Creek Rd Unit 8110617
- 0 Cedar Creek Rd Unit 3005853
- 0 Cedar Creek Rd Unit 7441916
- 0 Cedar Creek Rd Unit 8055768
- 0 Cedar Creek Rd Unit 8381010
- 0 Cedar Creek Rd Unit 9014694
- 299 Highway 211 NW
- 311 Cedar Creek Rd