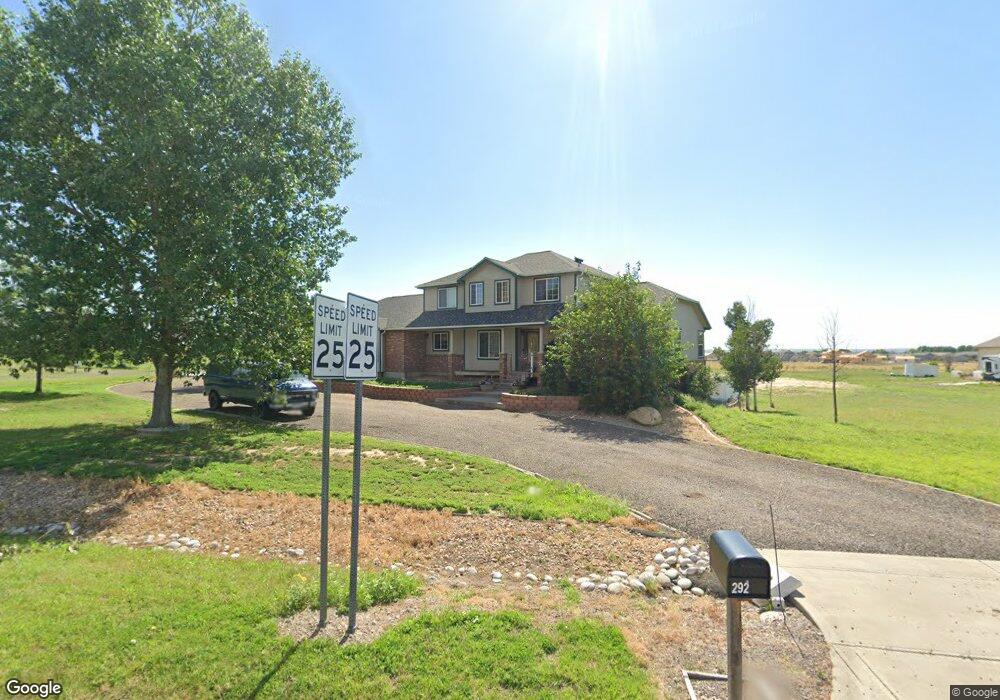
292 Pioneer Way Brighton, CO 80603
Estimated Value: $694,000 - $965,000
4
Beds
5
Baths
2,593
Sq Ft
$301/Sq Ft
Est. Value
About This Home
This home is located at 292 Pioneer Way, Brighton, CO 80603 and is currently estimated at $779,365, approximately $300 per square foot. 292 Pioneer Way is a home located in Weld County with nearby schools including Overland Trail Middle School, Brighton High School, and Foundations Academy.
Ownership History
Date
Name
Owned For
Owner Type
Purchase Details
Closed on
Dec 17, 2001
Sold by
Lowe Marnell V and Modica Richard T
Bought by
Modica Richard T and Modica Shelly K
Current Estimated Value
Home Financials for this Owner
Home Financials are based on the most recent Mortgage that was taken out on this home.
Original Mortgage
$344,500
Outstanding Balance
$133,015
Interest Rate
6.41%
Estimated Equity
$646,350
Purchase Details
Closed on
Jun 23, 1999
Sold by
Lowe Marnell V and Lowe Modica T
Bought by
Lowe Marnell V and Modica Richard T
Home Financials for this Owner
Home Financials are based on the most recent Mortgage that was taken out on this home.
Original Mortgage
$230,000
Interest Rate
7.39%
Purchase Details
Closed on
May 8, 1998
Sold by
Grein Construction Inc
Bought by
Lowe Marnell V and Modica Richard T
Purchase Details
Closed on
Jun 23, 1994
Sold by
Grein Ivan E and Grein Joan
Bought by
Grein Construction Inc
Create a Home Valuation Report for This Property
The Home Valuation Report is an in-depth analysis detailing your home's value as well as a comparison with similar homes in the area
Home Values in the Area
Average Home Value in this Area
Purchase History
| Date | Buyer | Sale Price | Title Company |
|---|---|---|---|
| Modica Richard T | -- | Land Title Guarantee Company | |
| Lowe Marnell V | -- | Universal Land Title | |
| Lowe Marnell V | $40,000 | -- | |
| Grein Construction Inc | -- | -- |
Source: Public Records
Mortgage History
| Date | Status | Borrower | Loan Amount |
|---|---|---|---|
| Open | Modica Richard T | $344,500 | |
| Closed | Lowe Marnell V | $230,000 |
Source: Public Records
Tax History Compared to Growth
Tax History
| Year | Tax Paid | Tax Assessment Tax Assessment Total Assessment is a certain percentage of the fair market value that is determined by local assessors to be the total taxable value of land and additions on the property. | Land | Improvement |
|---|---|---|---|---|
| 2025 | $3,810 | $49,550 | $10,000 | $39,550 |
| 2024 | $3,810 | $49,550 | $10,000 | $39,550 |
| 2023 | $3,636 | $41,530 | $10,820 | $30,710 |
| 2022 | $3,916 | $39,500 | $6,950 | $32,550 |
| 2021 | $3,662 | $40,630 | $7,150 | $33,480 |
| 2020 | $2,762 | $31,130 | $6,080 | $25,050 |
| 2019 | $2,773 | $31,130 | $6,080 | $25,050 |
| 2018 | $2,826 | $31,360 | $9,360 | $22,000 |
| 2017 | $2,817 | $31,360 | $9,360 | $22,000 |
| 2016 | $2,601 | $28,770 | $5,090 | $23,680 |
| 2015 | $2,581 | $28,770 | $5,090 | $23,680 |
| 2014 | $2,431 | $27,570 | $7,080 | $20,490 |
Source: Public Records
Map
Nearby Homes
- 4532 Dewey Ln
- 608 Hayloft Way
- 4545 Oxbow Dr
- 4649 Spinning Wheel Dr
- 445 Tumbleweed Dr
- 535 Meadow Ln
- 1019 Cable St
- 432 Hedgerow Way
- 4645 Longs Peak St
- 4250 Combine Place
- 427 Silo Ct
- 1032 Cable St
- 1977 Opal Ave
- 252 Firestone Cir
- 4479 Boone Cir
- 4455 Boone Cir
- 4439 Boone Cir
- 607 Azalea St
- 1790 Jade Ave
- 4776 Kipp Place
- 291 Pioneer Way
- 220 Pioneer Way
- 15401 Arrowhead Dr
- 303 Pioneer Way
- 15354 Arrowhead Dr
- 0 E 168th Ave and N 45th Ave Unit 7790610
- 182 Pioneer Way
- 191 Pioneer Way
- 344 Pioneer Way
- 15365 Arrowhead Dr
- 15394 Wagon Wheel Dr
- 15314 Arrowhead Dr
- 15337 Arrowhead Dr
- 360 Pioneer Way
- 152 Pioneer Way
- 171 Pioneer Way
- 15358 Wagon Wheel Dr
- 895 45th Ave
- 15294 Arrowhead Dr
- 15313 Arrowhead Dr