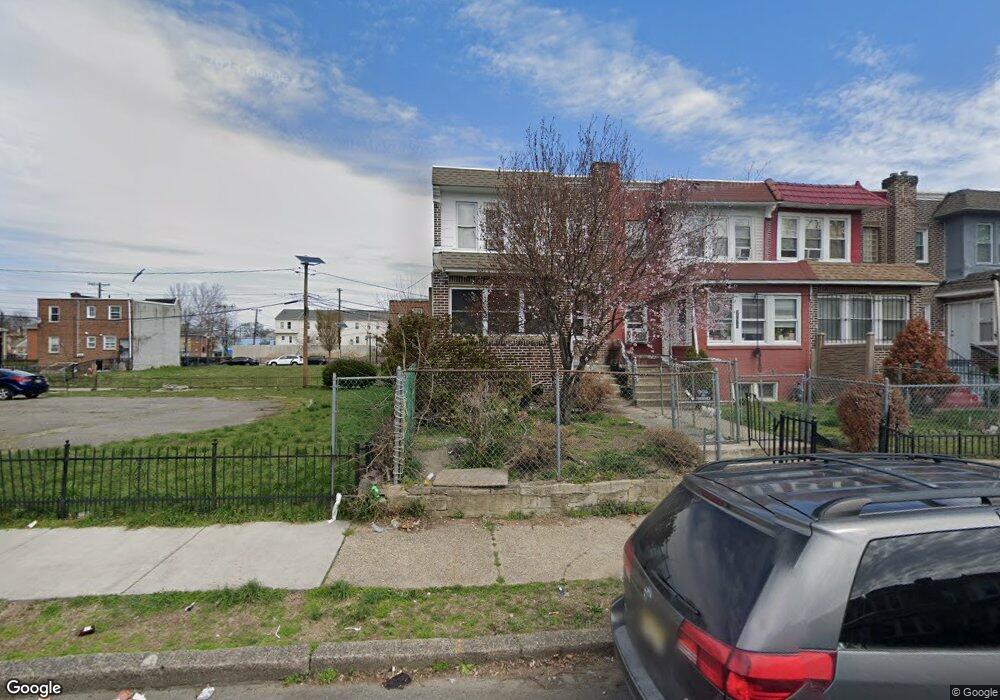
292 Rand St Camden, NJ 08105
Marlton NeighborhoodEstimated Value: $110,851 - $154,000
--
Bed
--
Bath
1,140
Sq Ft
$124/Sq Ft
Est. Value
About This Home
This home is located at 292 Rand St, Camden, NJ 08105 and is currently estimated at $141,463, approximately $124 per square foot. 292 Rand St is a home located in Camden County with nearby schools including Alfred Cramer College Preparatory Lab School, Eastside High School, and St Joseph Pro-Cathedral School.
Ownership History
Date
Name
Owned For
Owner Type
Purchase Details
Closed on
Feb 13, 2008
Sold by
Cedeno Benjamin and Orengo Omayda
Bought by
Cedeno Benjamin
Current Estimated Value
Purchase Details
Closed on
Nov 9, 1998
Sold by
Perez Luis M
Bought by
Cedeno Benjamin and Orengo Omayda
Purchase Details
Closed on
Apr 12, 1994
Sold by
Cohen Samuel
Bought by
Perez Luis and Laboy Merceds
Home Financials for this Owner
Home Financials are based on the most recent Mortgage that was taken out on this home.
Original Mortgage
$37,000
Interest Rate
7.7%
Create a Home Valuation Report for This Property
The Home Valuation Report is an in-depth analysis detailing your home's value as well as a comparison with similar homes in the area
Home Values in the Area
Average Home Value in this Area
Purchase History
| Date | Buyer | Sale Price | Title Company |
|---|---|---|---|
| Cedeno Benjamin | $6,000 | -- | |
| Cedeno Benjamin | $32,500 | -- | |
| Perez Luis | $39,000 | -- | |
| Cohen Samuel | $22,000 | -- |
Source: Public Records
Mortgage History
| Date | Status | Borrower | Loan Amount |
|---|---|---|---|
| Previous Owner | Cohen Samuel | $37,000 |
Source: Public Records
Tax History Compared to Growth
Tax History
| Year | Tax Paid | Tax Assessment Tax Assessment Total Assessment is a certain percentage of the fair market value that is determined by local assessors to be the total taxable value of land and additions on the property. | Land | Improvement |
|---|---|---|---|---|
| 2025 | $2,172 | $61,300 | $18,400 | $42,900 |
| 2024 | $2,100 | $61,300 | $18,400 | $42,900 |
| 2023 | $2,100 | $61,300 | $18,400 | $42,900 |
| 2022 | $2,060 | $61,300 | $18,400 | $42,900 |
| 2021 | $2,053 | $61,300 | $18,400 | $42,900 |
| 2020 | $1,949 | $61,300 | $18,400 | $42,900 |
| 2019 | $1,867 | $61,300 | $18,400 | $42,900 |
| 2018 | $1,857 | $61,300 | $18,400 | $42,900 |
| 2017 | $1,811 | $61,300 | $18,400 | $42,900 |
| 2016 | $1,754 | $61,300 | $18,400 | $42,900 |
| 2015 | $1,688 | $61,300 | $18,400 | $42,900 |
| 2014 | $1,648 | $61,300 | $18,400 | $42,900 |
Source: Public Records
Map
Nearby Homes
- 444 Pfeiffer St
- 506 Pfeiffer St
- 477 Rand St
- 420 Boyd St
- 341 Marlton Ave
- 603 Raritan St
- 2598 Baird Blvd
- 608 Raritan St
- 555 Pfeiffer St
- 154 Eutaw Ave
- 2621 Westfield Ave
- 41 N 24th St
- 32 N 25th St
- 7130 Rosemont Ave
- 355 S 27th St
- 127 N 23rd St
- 2707 Westfield Ave
- 2709 Westfield Ave
- 2112 Howell St
- 7186 Waldorf Ave