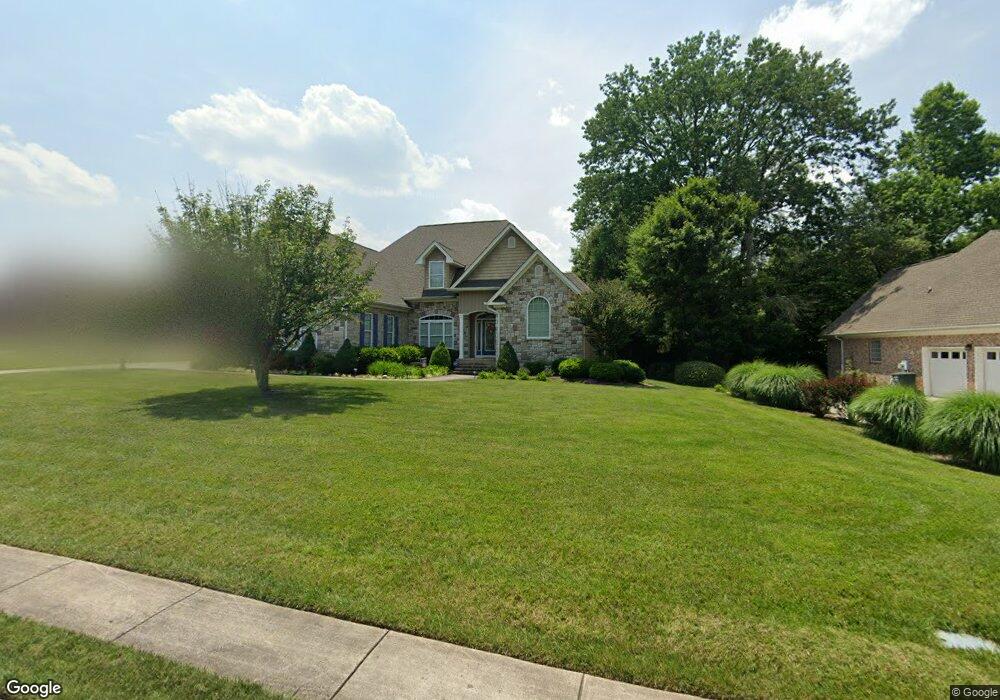
292 Winding Ridge Rd Rock Spring, GA 30739
Rock Spring NeighborhoodEstimated Value: $399,999 - $488,000
--
Bed
2
Baths
2,398
Sq Ft
$190/Sq Ft
Est. Value
About This Home
This home is located at 292 Winding Ridge Rd, Rock Spring, GA 30739 and is currently estimated at $454,750, approximately $189 per square foot. 292 Winding Ridge Rd is a home located in Walker County with nearby schools including Lafayette High School.
Ownership History
Date
Name
Owned For
Owner Type
Purchase Details
Closed on
Oct 31, 2012
Sold by
Bell Ken
Bought by
Farris Ronald A and Farris Sheryl B
Current Estimated Value
Home Financials for this Owner
Home Financials are based on the most recent Mortgage that was taken out on this home.
Original Mortgage
$188,000
Outstanding Balance
$129,973
Interest Rate
3.4%
Mortgage Type
New Conventional
Estimated Equity
$324,777
Purchase Details
Closed on
Aug 15, 2006
Sold by
Bell Ken
Bought by
Bell Ken
Purchase Details
Closed on
Jul 31, 2006
Sold by
Not Provided
Bought by
Bell Ken and Bell Karen
Purchase Details
Closed on
Jul 27, 2006
Sold by
Nance Don
Bought by
Bell Ken
Purchase Details
Closed on
Nov 19, 2004
Sold by
Catlett Developement Llc
Bought by
Nance Don
Purchase Details
Closed on
Jul 30, 1999
Bought by
Catlett Developement Llc
Create a Home Valuation Report for This Property
The Home Valuation Report is an in-depth analysis detailing your home's value as well as a comparison with similar homes in the area
Home Values in the Area
Average Home Value in this Area
Purchase History
| Date | Buyer | Sale Price | Title Company |
|---|---|---|---|
| Farris Ronald A | $235,000 | -- | |
| Bell Ken | -- | -- | |
| Bell Ken | -- | -- | |
| Bell Ken | -- | -- | |
| Nance Don | $30,000 | -- | |
| Catlett Developement Llc | -- | -- |
Source: Public Records
Mortgage History
| Date | Status | Borrower | Loan Amount |
|---|---|---|---|
| Open | Farris Ronald A | $188,000 |
Source: Public Records
Tax History Compared to Growth
Tax History
| Year | Tax Paid | Tax Assessment Tax Assessment Total Assessment is a certain percentage of the fair market value that is determined by local assessors to be the total taxable value of land and additions on the property. | Land | Improvement |
|---|---|---|---|---|
| 2024 | $3,625 | $163,917 | $14,000 | $149,917 |
| 2023 | $3,530 | $156,173 | $14,000 | $142,173 |
| 2022 | $3,364 | $136,461 | $14,000 | $122,461 |
| 2021 | $3,085 | $112,637 | $12,000 | $100,637 |
| 2020 | $2,586 | $89,897 | $12,000 | $77,897 |
| 2019 | $2,632 | $89,897 | $12,000 | $77,897 |
| 2018 | $2,379 | $89,897 | $12,000 | $77,897 |
| 2017 | $2,880 | $89,897 | $12,000 | $77,897 |
| 2016 | $2,281 | $89,897 | $12,000 | $77,897 |
| 2015 | $2,311 | $85,720 | $12,000 | $73,720 |
| 2014 | $2,177 | $85,720 | $12,000 | $73,720 |
| 2013 | -- | $85,720 | $12,000 | $73,720 |
Source: Public Records
Map
Nearby Homes
- 183 Long Hollow Rd
- 294 E Long Hollow Rd
- 788 Long Hollow Rd
- 103 Deer Ridge Ln
- 200 Hunting Ridge Cir
- 70 Deer Ridge Ln
- 54 Cedar Farm Ln
- 1121 Arnold Rd
- 124 Fieldstone Commons
- 453 Harvest Ln
- 918 Old Lafayette Rd
- 1476 Arnold Rd
- 36 Pheonix Cir
- 195 Honeysuckle Dr
- 285 Cooper Rd
- 28 Cobblestone Trail
- 59 Honeysuckle Dr
- 386 Twelve Oaks Dr
- 149 Stone Throw Ln
- 135 Stone Throw Ln
- 302 Winding Ridge Rd
- 270 Winding Ridge Rd
- 252 Winding Ridge Rd
- 171 Arnold Rd
- 334 Winding Ridge Rd
- 189 Arnold Rd
- 147 Arnold Rd
- Lot 21 Winding Ridge Rd
- Lot 45 Winding Ridge Rd
- 481 Winding Ridge Rd
- 309 Winding Ridge Rd
- 157 Arnold Rd
- 232 Winding Ridge Rd
- 279 Winding Ridge Rd
- 229 Arnold Rd
- 342 Winding Ridge Rd
- 335 Winding Ridge Rd
- 227 Winding Ridge Rd
- 362 Winding Ridge Rd
- 365 Winding Ridge Rd