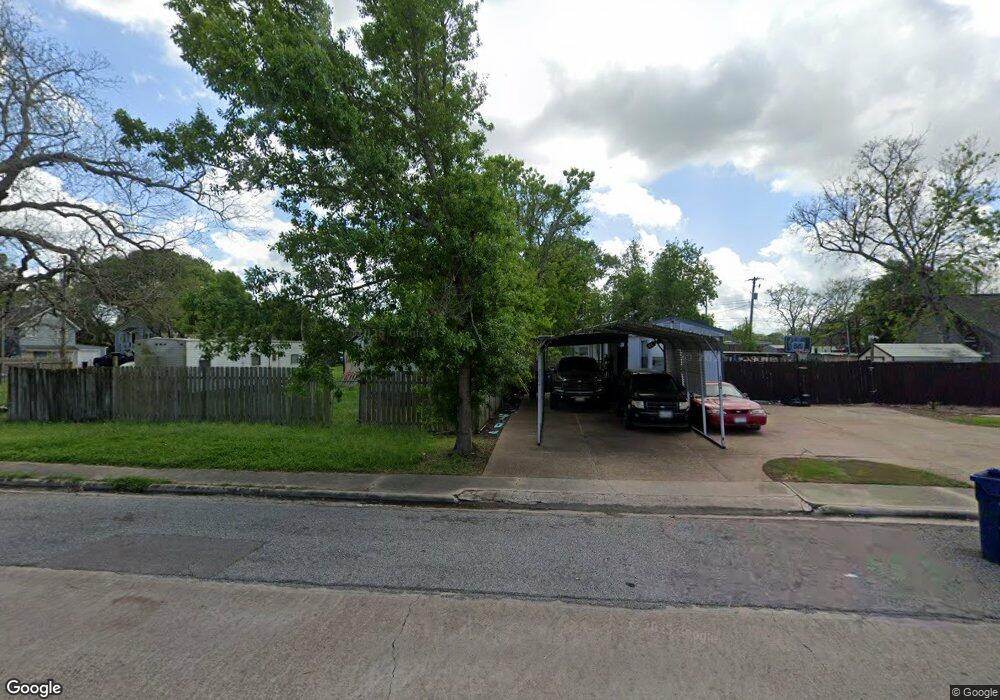
2920 4th St Bay City, TX 77414
Estimated Value: $166,000 - $208,000
--
Bed
--
Bath
1,712
Sq Ft
$112/Sq Ft
Est. Value
About This Home
This home is located at 2920 4th St, Bay City, TX 77414 and is currently estimated at $191,743, approximately $111 per square foot. 2920 4th St is a home located in Matagorda County with nearby schools including John H. Cherry Elementary School, Bay City Junior High School, and Bay City High School.
Ownership History
Date
Name
Owned For
Owner Type
Purchase Details
Closed on
Oct 17, 2024
Sold by
Lh Iii Llc and Lh3 Lwestments Llc
Bought by
Morales Maurilio
Current Estimated Value
Home Financials for this Owner
Home Financials are based on the most recent Mortgage that was taken out on this home.
Original Mortgage
$166,666
Outstanding Balance
$164,914
Interest Rate
6.35%
Mortgage Type
New Conventional
Estimated Equity
$26,829
Purchase Details
Closed on
Aug 26, 2022
Sold by
Shearer Nanette M
Bought by
Lh Iii Llc
Home Financials for this Owner
Home Financials are based on the most recent Mortgage that was taken out on this home.
Original Mortgage
$159,300
Interest Rate
5.51%
Mortgage Type
Construction
Create a Home Valuation Report for This Property
The Home Valuation Report is an in-depth analysis detailing your home's value as well as a comparison with similar homes in the area
Home Values in the Area
Average Home Value in this Area
Purchase History
| Date | Buyer | Sale Price | Title Company |
|---|---|---|---|
| Morales Maurilio | -- | Bay City Abstract & Title | |
| Lh Iii Llc | -- | -- |
Source: Public Records
Mortgage History
| Date | Status | Borrower | Loan Amount |
|---|---|---|---|
| Open | Morales Maurilio | $166,666 | |
| Previous Owner | Lh Iii Llc | $159,300 |
Source: Public Records
Tax History Compared to Growth
Tax History
| Year | Tax Paid | Tax Assessment Tax Assessment Total Assessment is a certain percentage of the fair market value that is determined by local assessors to be the total taxable value of land and additions on the property. | Land | Improvement |
|---|---|---|---|---|
| 2024 | $44 | $186,700 | $39,440 | $147,260 |
| 2023 | $4,047 | $173,680 | $38,500 | $135,180 |
| 2022 | $3,153 | $118,090 | $20,000 | $98,090 |
| 2021 | $3,044 | $103,600 | $14,500 | $89,100 |
| 2020 | $2,735 | $89,490 | $14,500 | $74,990 |
| 2019 | $2,806 | $91,850 | $14,500 | $77,350 |
| 2018 | $2,777 | $94,260 | $14,500 | $79,760 |
| 2017 | $2,698 | $96,630 | $14,500 | $82,130 |
| 2016 | $2,094 | $75,000 | $14,500 | $60,500 |
| 2015 | -- | $75,000 | $14,500 | $60,500 |
| 2014 | -- | $60,720 | $14,500 | $46,220 |
Source: Public Records
Map
Nearby Homes