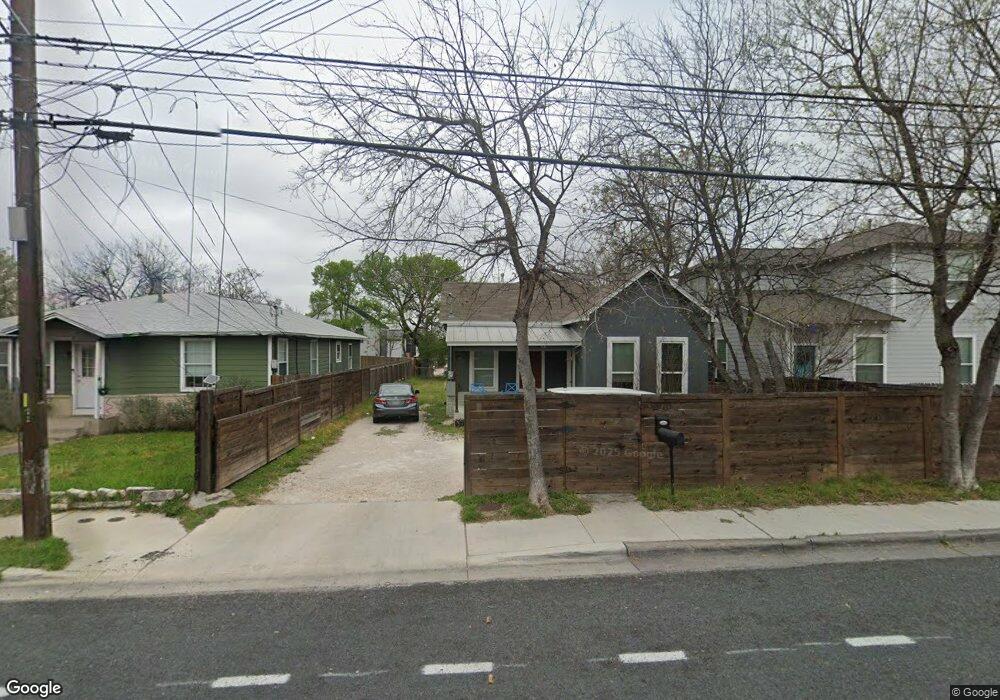
2920 E 12th St Unit A Austin, TX 78702
Rosewood NeighborhoodEstimated Value: $424,000 - $449,000
3
Beds
2
Baths
1,020
Sq Ft
$431/Sq Ft
Est. Value
About This Home
This home is located at 2920 E 12th St Unit A, Austin, TX 78702 and is currently estimated at $439,323, approximately $430 per square foot. 2920 E 12th St Unit A is a home located in Travis County with nearby schools including Campbell Elementary School, Kealing Middle School, and McCallum High School.
Ownership History
Date
Name
Owned For
Owner Type
Purchase Details
Closed on
Jan 4, 2019
Sold by
2017 Kermit Lp
Bought by
2018 Single Family Fund 2 Lp
Current Estimated Value
Purchase Details
Closed on
Sep 12, 2017
Sold by
Poquito Rex Llc
Bought by
2017 Kermit Lp
Home Financials for this Owner
Home Financials are based on the most recent Mortgage that was taken out on this home.
Original Mortgage
$386,250
Interest Rate
3.93%
Purchase Details
Closed on
Aug 12, 2017
Sold by
Poquito Rex Llc
Bought by
2017 Kermit Lp
Home Financials for this Owner
Home Financials are based on the most recent Mortgage that was taken out on this home.
Original Mortgage
$386,250
Interest Rate
3.93%
Purchase Details
Closed on
Jun 23, 2016
Sold by
Berlke Judith Suzanne
Bought by
Cockburn James Donald
Purchase Details
Closed on
Nov 27, 1996
Sold by
Beilke Judith Suzanne
Bought by
Beilke Judith Suzanne and Cockburn James Donald
Create a Home Valuation Report for This Property
The Home Valuation Report is an in-depth analysis detailing your home's value as well as a comparison with similar homes in the area
Home Values in the Area
Average Home Value in this Area
Purchase History
| Date | Buyer | Sale Price | Title Company |
|---|---|---|---|
| 2018 Single Family Fund 2 Lp | -- | None Available | |
| 2017 Kermit Lp | -- | Independence Title | |
| 2017 Kermit Lp | -- | Independence Title | |
| Cockburn James Donald | -- | None Available | |
| Beilke Judith Suzanne | -- | -- |
Source: Public Records
Mortgage History
| Date | Status | Borrower | Loan Amount |
|---|---|---|---|
| Previous Owner | 2017 Kermit Lp | $386,250 | |
| Closed | 2018 Single Family Fund 2 Lp | $0 |
Source: Public Records
Tax History
| Year | Tax Paid | Tax Assessment Tax Assessment Total Assessment is a certain percentage of the fair market value that is determined by local assessors to be the total taxable value of land and additions on the property. | Land | Improvement |
|---|---|---|---|---|
| 2025 | $9,158 | $447,477 | $158,773 | $288,704 |
| 2023 | $12,120 | $669,910 | $300,000 | $369,910 |
| 2022 | $11,193 | $566,733 | $300,000 | $266,733 |
| 2021 | $9,881 | $453,934 | $300,000 | $153,934 |
| 2020 | $8,148 | $379,900 | $200,000 | $179,900 |
| 2018 | $7,672 | $346,531 | $200,000 | $146,531 |
| 2017 | $5,503 | $246,762 | $200,000 | $46,762 |
| 2016 | $3,508 | $157,319 | $200,000 | $57,283 |
| 2015 | $665 | $143,017 | $120,000 | $71,382 |
| 2014 | $665 | $130,015 | $0 | $0 |
Source: Public Records
Map
Nearby Homes
- 2909 E 13th St Unit 2
- 2941 E 14th St Unit 2
- 1180 1/2 Sol Wilson Ave
- 1612 Clifford Ave
- 3010 E 12th St
- 1601 Miriam Ave Unit 216
- 2505 Sol Wilson Ave
- 1606 Harvey St Unit 1
- 1181 Ridgeway Dr
- 1167 Bedford St Unit 1
- 1189 Oakgrove Ave
- 1610 Harvey St Unit B
- 1303 Walnut Ave
- 1181 Oakgrove Ave
- 1200 Walnut Ave
- 1803 Clifford Ave
- 1702 Miriam Ave
- 1600 Walnut Ave
- 1407 Cedar Ave Unit 2
- 3104 E 16th St
- 2920 E 12th St
- 2922 E 12th St Unit B
- 2922 E 12th St
- 2918 E 12th St
- 2916 E 12th St
- 2924 E 12th St
- 2924 E 12th St Unit B
- 2924 E 12th St Unit A
- 2921 E 13th St
- 2917 E 12th St
- 2917 E 12th St Unit A
- 2917 E 12th St Unit B
- 2926 E 12th St
- 2912 E 12th St
- 2912 E 12th St Unit A
- 2919 E 13th St
- 2919 E 13th St Unit 2
- 2919 E 13th St Unit 1
- 2919 E 13th St Unit B
- 2919 E 13th St Unit A
Your Personal Tour Guide
Ask me questions while you tour the home.