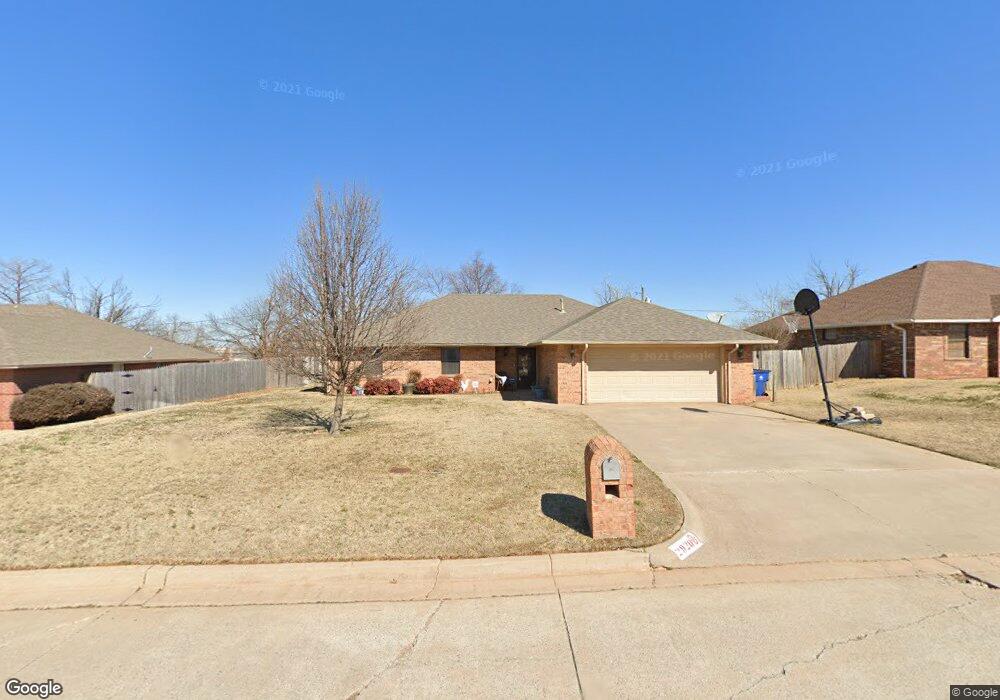
2920 Lacey Dr Chickasha, OK 73018
Estimated Value: $194,000 - $243,000
3
Beds
2
Baths
1,870
Sq Ft
$120/Sq Ft
Est. Value
About This Home
This home is located at 2920 Lacey Dr, Chickasha, OK 73018 and is currently estimated at $225,120, approximately $120 per square foot. 2920 Lacey Dr is a home located in Grady County with nearby schools including Grand Avenue Elementary School, Chickasha Middle School, and Lincoln Elementary School.
Ownership History
Date
Name
Owned For
Owner Type
Purchase Details
Closed on
Sep 29, 2017
Sold by
Thomas Terri A
Bought by
Thomas Terri A and Thomas Revin R
Current Estimated Value
Purchase Details
Closed on
May 29, 2009
Sold by
Pazderka Jeanne M
Bought by
Cannon Mary Tess and Dunkin Glen T
Home Financials for this Owner
Home Financials are based on the most recent Mortgage that was taken out on this home.
Original Mortgage
$116,745
Interest Rate
4.7%
Mortgage Type
FHA
Purchase Details
Closed on
Apr 18, 2005
Sold by
Berry Danny and Berry Terry
Bought by
Pazderka Jeanne M
Home Financials for this Owner
Home Financials are based on the most recent Mortgage that was taken out on this home.
Original Mortgage
$92,800
Interest Rate
5.78%
Mortgage Type
New Conventional
Purchase Details
Closed on
Apr 15, 1994
Sold by
Jimmy Smith
Bought by
Terry Woodruff
Create a Home Valuation Report for This Property
The Home Valuation Report is an in-depth analysis detailing your home's value as well as a comparison with similar homes in the area
Home Values in the Area
Average Home Value in this Area
Purchase History
| Date | Buyer | Sale Price | Title Company |
|---|---|---|---|
| Thomas Terri A | -- | None Available | |
| Cannon Mary Tess | $119,000 | None Available | |
| Pazderka Jeanne M | $116,000 | None Available | |
| Terry Woodruff | $84,000 | -- |
Source: Public Records
Mortgage History
| Date | Status | Borrower | Loan Amount |
|---|---|---|---|
| Previous Owner | Cannon Mary Tess | $116,745 | |
| Previous Owner | Pazderka Jeanne M | $92,800 |
Source: Public Records
Tax History Compared to Growth
Tax History
| Year | Tax Paid | Tax Assessment Tax Assessment Total Assessment is a certain percentage of the fair market value that is determined by local assessors to be the total taxable value of land and additions on the property. | Land | Improvement |
|---|---|---|---|---|
| 2025 | $1,736 | $17,973 | $1,847 | $16,126 |
| 2024 | $1,736 | $17,117 | $1,759 | $15,358 |
| 2023 | $1,736 | $16,302 | $1,856 | $14,446 |
| 2022 | $1,645 | $15,820 | $1,856 | $13,964 |
| 2021 | $1,583 | $15,753 | $1,482 | $14,271 |
| 2020 | $1,653 | $16,053 | $1,482 | $14,571 |
| 2019 | $1,630 | $16,132 | $1,482 | $14,650 |
| 2018 | $1,617 | $15,708 | $1,399 | $14,309 |
| 2017 | $1,549 | $14,960 | $1,650 | $13,310 |
| 2016 | $1,562 | $14,960 | $1,650 | $13,310 |
| 2015 | $1,439 | $14,157 | $1,403 | $12,754 |
| 2014 | $1,439 | $13,745 | $1,335 | $12,410 |
Source: Public Records
Map
Nearby Homes
- 3017 Glenwood Dr
- 3011 Heatherwood Dr
- 3005 Alli Cir
- 2804 S 4th St
- 523 W Country Club Rd
- 136 Skyline Dr
- 142 Skyline Dr
- 149 Skyline Dr
- 0000 E Grand Ave
- 909 Hazy Brook Cir
- 916 Hazy Brook Cir
- 913 Hazy Brook Cir
- 921 Hazy Brook Cir
- 917 Hazy Brook Cir
- 908 Hazy Brook Cir
- 912 Hazy Brook Cir
- 904 Hazy Brook Cir
- 916 Shady Meadow Way
- 908 Shady Meadow Way
- 920 Shady Meadow Way
- 2918 Lacey Dr
- 2924 Lacey Dr
- 2916 Lacey Dr
- 2921 Lacey Dr
- 2926 Lacey Dr
- 2917 Lacey Dr
- 2928 Lacey Dr
- 3002 Heatherwood Dr
- 3003 Lacey Dr
- 2719 Valley View Cir
- 2729 Valley View Cir
- 2817 Briar Creek
- 2901 Briar Creek
- 2914 Lacey Dr
- 3004 Heatherwood Dr
- 3002 Lacey Dr
- 2903 Briar Creek
- 2815 Briar Creek
- 3007 Lacey Dr
- 2912 Lacey Dr