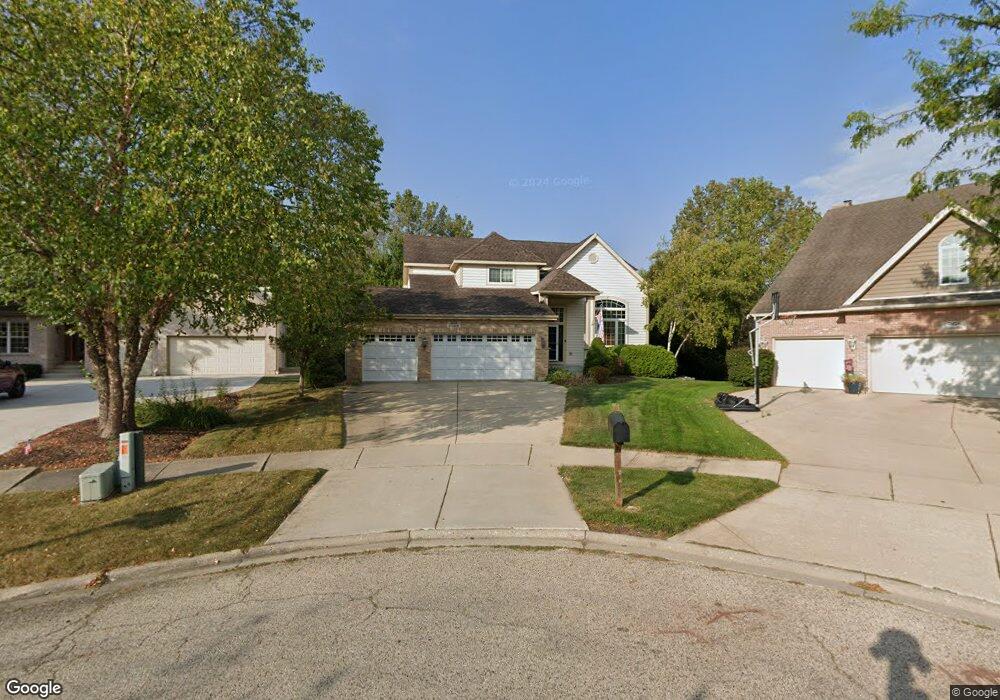
2920 N Cypress Point Wadsworth, IL 60083
The Links at Midlane NeighborhoodEstimated Value: $519,000 - $524,000
4
Beds
4
Baths
3,064
Sq Ft
$170/Sq Ft
Est. Value
About This Home
This home is located at 2920 N Cypress Point, Wadsworth, IL 60083 and is currently estimated at $520,937, approximately $170 per square foot. 2920 N Cypress Point is a home located in Lake County with nearby schools including Spaulding Elementary School, Viking Middle School, and Warren Township High School.
Ownership History
Date
Name
Owned For
Owner Type
Purchase Details
Closed on
Mar 2, 2021
Sold by
Grabowski Bryan M
Bought by
Grabowski Bryan M and Grabowski Bryan M
Current Estimated Value
Purchase Details
Closed on
Jul 8, 2020
Sold by
Grabowski Sheila Ann
Bought by
Grabowski Bryan M
Home Financials for this Owner
Home Financials are based on the most recent Mortgage that was taken out on this home.
Original Mortgage
$91,300
Interest Rate
2.75%
Mortgage Type
New Conventional
Purchase Details
Closed on
Feb 14, 2002
Sold by
Cole Taylor Bank
Bought by
Grabowski Bryan M and Grabowski Sheila Ann
Home Financials for this Owner
Home Financials are based on the most recent Mortgage that was taken out on this home.
Original Mortgage
$273,750
Interest Rate
6.95%
Create a Home Valuation Report for This Property
The Home Valuation Report is an in-depth analysis detailing your home's value as well as a comparison with similar homes in the area
Home Values in the Area
Average Home Value in this Area
Purchase History
| Date | Buyer | Sale Price | Title Company |
|---|---|---|---|
| Grabowski Bryan M | -- | Attorney | |
| Grabowski Bryan M | $88,000 | Attorney | |
| Grabowski Bryan M | $342,500 | First American Title |
Source: Public Records
Mortgage History
| Date | Status | Borrower | Loan Amount |
|---|---|---|---|
| Previous Owner | Grabowski Bryan M | $91,300 | |
| Previous Owner | Grabowski Bryan M | $273,750 |
Source: Public Records
Tax History Compared to Growth
Tax History
| Year | Tax Paid | Tax Assessment Tax Assessment Total Assessment is a certain percentage of the fair market value that is determined by local assessors to be the total taxable value of land and additions on the property. | Land | Improvement |
|---|---|---|---|---|
| 2024 | $15,716 | $144,456 | $21,295 | $123,161 |
| 2023 | $13,792 | $134,116 | $19,771 | $114,345 |
| 2022 | $13,792 | $116,470 | $22,115 | $94,355 |
| 2021 | $12,887 | $111,797 | $21,228 | $90,569 |
| 2020 | $12,694 | $109,049 | $20,706 | $88,343 |
| 2019 | $12,561 | $105,883 | $20,105 | $85,778 |
| 2018 | $13,184 | $108,734 | $31,992 | $76,742 |
| 2017 | $13,084 | $105,618 | $31,075 | $74,543 |
| 2016 | $12,733 | $100,915 | $29,691 | $71,224 |
| 2015 | $14,133 | $106,623 | $28,328 | $78,295 |
| 2014 | $13,130 | $102,538 | $27,962 | $74,576 |
| 2012 | $12,041 | $109,749 | $28,176 | $81,573 |
Source: Public Records
Map
Nearby Homes
- 3068 N Southern Hills Dr
- 4605 Sawgrass Blvd Unit 1202
- 4827 W Pebble Beach Dr
- 3050 Nicklaus Ln
- 3077 Nicklaus Ln Unit 4
- 3148 Concord Ln
- 3015 Monterey Ln
- 3267 Hampshire Ln
- 37114 N Shirley Dr
- 3248 Hampshire Ln
- 3300 Country Ln
- 4171 Midlane Dr
- 2634 Woodview Ct Unit 5
- 2670 Woodview Ct Unit 1
- 4150 Midlane Dr
- 38148 N Helena Ln
- 36396 N Skokie Hwy
- 5205 Notting Hill Rd
- 15860 W Thornapple Ln
- 0 Ryan Rd
- 2912 N Cypress Point
- 2928 N Cypress Point
- 2919 N Cypress Point
- 2936 N Cypress Point
- 2923 N Southern Hills Dr
- 2929 N Southern Hills Dr
- 2917 N Southern Hills Dr
- 2927 N Cypress Point
- 2933 N Southern Hills Dr
- 2935 N Cypress Point
- 2911 N Southern Hills Dr
- 2944 N Cypress Point
- 2939 N Southern Hills Dr
- 2943 N Cypress Point
- 2966 N Cypress Point
- 2947 N Southern Hills Dr
- 2899 N Southern Hills Dr
- 2924 N Southern Hills Dr
- 2932 N Southern Hills Dr
- 2900 N Southern Hills Dr