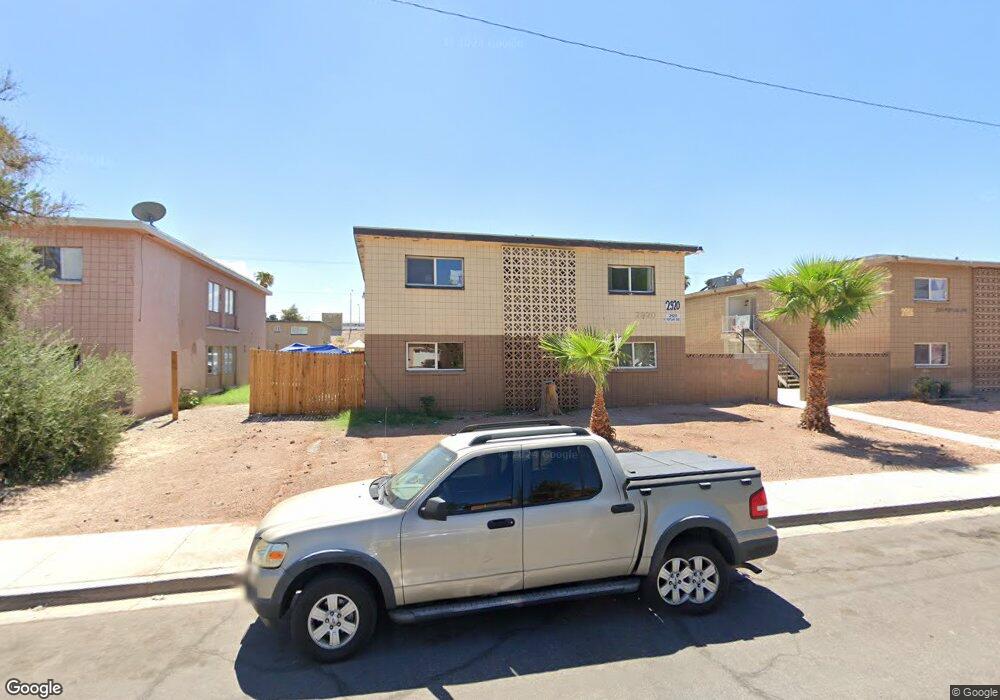
2920 Poplar Ave Unit 4 Las Vegas, NV 89101
East Las Vegas NeighborhoodEstimated Value: $328,893 - $652,000
8
Beds
8
Baths
3,880
Sq Ft
$144/Sq Ft
Est. Value
About This Home
This home is located at 2920 Poplar Ave Unit 4, Las Vegas, NV 89101 and is currently estimated at $558,473, approximately $143 per square foot. 2920 Poplar Ave Unit 4 is a home located in Clark County with nearby schools including Sunrise Acres Elementary School, Roy West Martin Middle School, and Desert Pines High School.
Ownership History
Date
Name
Owned For
Owner Type
Purchase Details
Closed on
Apr 16, 2015
Sold by
None Today Llc Seriex Ix
Bought by
The Bruce Cowan And Kay Kooltida Cowan L
Current Estimated Value
Purchase Details
Closed on
Jul 19, 2011
Sold by
Custom Estates Llc
Bought by
None Today Llc Series Ix
Purchase Details
Closed on
Jun 17, 2011
Sold by
Gibney Christopher J and Gibney Katherine H
Bought by
Custom Estates
Purchase Details
Closed on
Feb 24, 2005
Sold by
Delarson Lidia Esther Rodriguez
Bought by
Larson Glen L
Purchase Details
Closed on
Dec 7, 2004
Sold by
Larson Glen L
Bought by
Gibney Christopher J and Gibney Katherine H
Home Financials for this Owner
Home Financials are based on the most recent Mortgage that was taken out on this home.
Original Mortgage
$236,000
Interest Rate
5.5%
Mortgage Type
Unknown
Create a Home Valuation Report for This Property
The Home Valuation Report is an in-depth analysis detailing your home's value as well as a comparison with similar homes in the area
Home Values in the Area
Average Home Value in this Area
Purchase History
| Date | Buyer | Sale Price | Title Company |
|---|---|---|---|
| The Bruce Cowan And Kay Kooltida Cowan L | $145,000 | National Title Co | |
| None Today Llc Series Ix | $65,110 | Ticor Title Las Vegas | |
| Custom Estates | $47,236 | None Available | |
| Larson Glen L | -- | Fidelity National Title | |
| Gibney Christopher J | $295,000 | Fidelity National Title |
Source: Public Records
Mortgage History
| Date | Status | Borrower | Loan Amount |
|---|---|---|---|
| Previous Owner | Gibney Christopher J | $236,000 | |
| Closed | Gibney Christopher J | $29,500 |
Source: Public Records
Tax History Compared to Growth
Tax History
| Year | Tax Paid | Tax Assessment Tax Assessment Total Assessment is a certain percentage of the fair market value that is determined by local assessors to be the total taxable value of land and additions on the property. | Land | Improvement |
|---|---|---|---|---|
| 2025 | $1,210 | $79,983 | $42,000 | $37,983 |
| 2024 | $1,121 | $79,983 | $42,000 | $37,983 |
| 2023 | $1,121 | $79,756 | $46,550 | $33,206 |
| 2022 | $1,038 | $68,654 | $37,800 | $30,854 |
| 2021 | $961 | $60,173 | $31,500 | $28,673 |
| 2020 | $890 | $56,085 | $28,000 | $28,085 |
| 2019 | $834 | $52,485 | $25,200 | $27,285 |
| 2018 | $796 | $44,029 | $18,200 | $25,829 |
| 2017 | $1,220 | $37,218 | $11,900 | $25,318 |
| 2016 | $746 | $34,668 | $9,800 | $24,868 |
| 2015 | $743 | $30,985 | $7,000 | $23,985 |
| 2014 | $720 | $30,044 | $7,000 | $23,044 |
Source: Public Records
Map
Nearby Homes
- 2943 Poplar Ave
- 2915 Cedar Ave Unit 11C
- 506 Wardelle St Unit C
- 2812 Marlin Ave
- 520 N 28th St
- 2645 Cedar Ave
- 2516 E Mesquite Ave
- 2513 Cedar Ave
- 2600 E Bonanza Rd
- 0 Mcknight St
- 802 Stewart Ave
- 2218 E Mesquite Ave
- 920 E Bonanza Rd
- 2528 Sunrise Ave
- 2408 Berkley Ave
- 50 N 27th St
- 2538 Valley St
- 921 Delta St
- 3700 Stewart Ave Unit 183
- 3121 E Charleston Blvd
- 2924 Poplar Ave
- 2916 Poplar Ave Unit 4
- 2928 Poplar Ave
- 2928 Poplar Ave Unit 4
- 2928 Poplar Ave Unit 3
- 2928 Poplar Ave Unit 1
- 2928 Poplar Ave Unit 2
- 2912 Poplar Ave Unit 4
- 2921 Elm Ave
- 2921 Elm Ave Unit 4
- 2921 Elm Ave Unit 3
- 2917 Elm Ave
- 2925 Elm Ave
- 2908 Poplar Ave Unit 4
- 2908 Poplar Ave Unit 3
- 2932 Poplar Ave
- 2947 Poplar Ave
- 2951 Poplar Ave
- 2913 Elm Ave