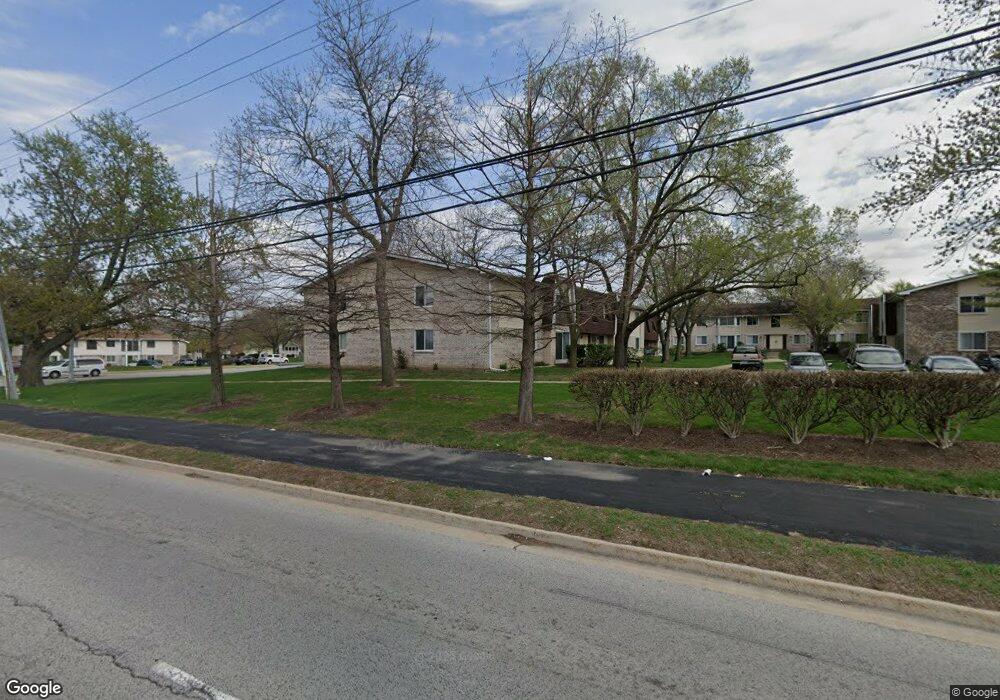
2920 Roberts Dr Unit 2 Woodridge, IL 60517
Hawthorne Hill NeighborhoodEstimated Value: $193,836 - $260,000
5
Beds
2
Baths
1,150
Sq Ft
$190/Sq Ft
Est. Value
About This Home
This home is located at 2920 Roberts Dr Unit 2, Woodridge, IL 60517 and is currently estimated at $217,959, approximately $189 per square foot. 2920 Roberts Dr Unit 2 is a home located in DuPage County with nearby schools including Meadowview Elementary School, Thomas Jefferson Junior High School, and Downer Grove North High School.
Ownership History
Date
Name
Owned For
Owner Type
Purchase Details
Closed on
Apr 29, 2005
Sold by
Carlsen Karen
Bought by
Comerford Marybeth and Santiago John
Current Estimated Value
Home Financials for this Owner
Home Financials are based on the most recent Mortgage that was taken out on this home.
Original Mortgage
$129,107
Outstanding Balance
$68,567
Interest Rate
6.13%
Mortgage Type
FHA
Estimated Equity
$149,392
Purchase Details
Closed on
Mar 27, 1997
Sold by
Evans Don M and Evans Carolyn A S
Bought by
Hansen Daniel Leonard and Hansen Tiffany F
Home Financials for this Owner
Home Financials are based on the most recent Mortgage that was taken out on this home.
Original Mortgage
$75,200
Interest Rate
7.65%
Mortgage Type
VA
Purchase Details
Closed on
Aug 29, 1994
Sold by
Keenan Rose Mary
Bought by
Evans Don M and Evans Carolyn A S
Home Financials for this Owner
Home Financials are based on the most recent Mortgage that was taken out on this home.
Original Mortgage
$63,500
Interest Rate
8.59%
Mortgage Type
FHA
Create a Home Valuation Report for This Property
The Home Valuation Report is an in-depth analysis detailing your home's value as well as a comparison with similar homes in the area
Home Values in the Area
Average Home Value in this Area
Purchase History
| Date | Buyer | Sale Price | Title Company |
|---|---|---|---|
| Comerford Marybeth | $133,500 | Midwest Title Services Llc | |
| Hansen Daniel Leonard | $74,000 | -- | |
| Evans Don M | $65,000 | Law Title Insurance |
Source: Public Records
Mortgage History
| Date | Status | Borrower | Loan Amount |
|---|---|---|---|
| Open | Comerford Marybeth | $129,107 | |
| Previous Owner | Hansen Daniel Leonard | $75,200 | |
| Previous Owner | Evans Don M | $63,500 |
Source: Public Records
Tax History Compared to Growth
Tax History
| Year | Tax Paid | Tax Assessment Tax Assessment Total Assessment is a certain percentage of the fair market value that is determined by local assessors to be the total taxable value of land and additions on the property. | Land | Improvement |
|---|---|---|---|---|
| 2024 | $3,666 | $45,011 | $4,832 | $40,179 |
| 2023 | $2,856 | $41,080 | $4,410 | $36,670 |
| 2022 | $2,597 | $37,240 | $4,000 | $33,240 |
| 2021 | $2,483 | $35,830 | $3,850 | $31,980 |
| 2020 | $2,448 | $35,180 | $3,780 | $31,400 |
| 2019 | $2,380 | $33,660 | $3,620 | $30,040 |
| 2018 | $1,799 | $24,540 | $2,640 | $21,900 |
| 2017 | $1,753 | $23,710 | $2,550 | $21,160 |
| 2016 | $1,727 | $22,850 | $2,460 | $20,390 |
| 2015 | $1,520 | $21,520 | $2,320 | $19,200 |
| 2014 | $1,425 | $20,110 | $2,170 | $17,940 |
| 2013 | $1,902 | $25,180 | $2,710 | $22,470 |
Source: Public Records
Map
Nearby Homes
- 3008 Roberts Dr Unit 5
- 3108 Roberts Dr Unit 6
- 2823 Cooper Ct
- 2699 Hobson Rd Unit 6
- 6932 Martin Dr
- 7024 Roberts Dr
- 6805 Westmoreland Dr
- 2640 Mitchell Dr Unit 5
- 7S745 State Route 53
- 6851 Larkspur Ct
- 2658 Sumac St
- 6613 Carl Ct
- 6313 Macarthur Dr
- 18 Woodsorrel Place
- 6420 Double Eagle Dr Unit 510
- 6420 Double Eagle Dr Unit E35
- 2486 Brunswick Cir Unit A2
- 2559 Cedar Hill Ln
- 14 Kildeer Ct
- 3550 Irving Place
- 2924 Roberts Dr Unit 2
- 2924 Roberts Dr Unit 8
- 2924 Roberts Dr Unit 3
- 2924 Roberts Dr Unit 4
- 2924 Roberts Dr Unit 1
- 2924 Roberts Dr Unit 165
- 2924 Roberts Dr Unit 7
- 2924 Roberts Dr Unit 6
- 2920 Roberts Dr Unit 6
- 2920 Roberts Dr Unit 5
- 2920 Roberts Dr Unit 4
- 2920 Roberts Dr Unit 7
- 2920 Roberts Dr Unit 1
- 2920 Roberts Dr Unit 178
- 2920 Roberts Dr Unit 8
- 2920 Roberts Dr Unit 3
- 2928 Roberts Dr Unit 8
- 2928 Roberts Dr Unit 7
- 3004 Roberts Dr Unit 127
- 3004 Roberts Dr Unit 6