2920 Susan Dr Bismarck, ND 58504
Estimated Value: $452,000 - $565,000
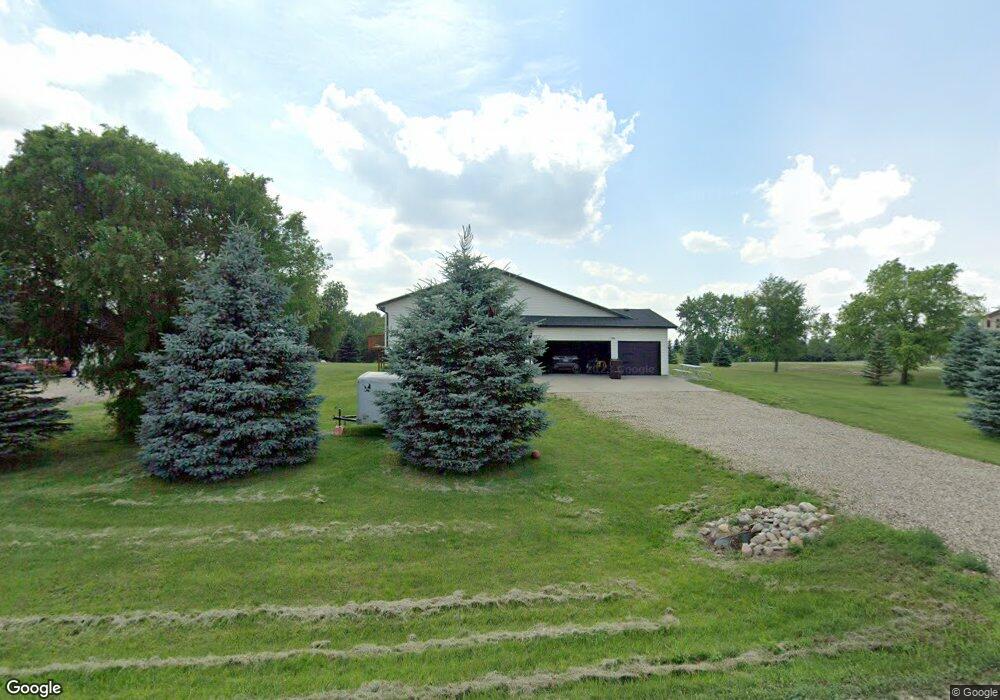
About This Home
This home is located at 2920 Susan Dr, Bismarck, ND 58504 and is currently estimated at $504,649, approximately $211 per square foot. 2920 Susan Dr is a home located in Burleigh County.
Ownership History
We collect this data history from publicly available records. To have your information removed, we recommend requesting removal directly through your county’s website.
Purchase Details
Home Financials for this Owner
Home Financials are based on the most recent Mortgage that was taken out on this home.Purchase Details
Home Financials for this Owner
Home Financials are based on the most recent Mortgage that was taken out on this home.Purchase Details
Home Values in the Area
Average Home Value in this Area
Purchase History
We collect this data history from publicly available records. To have your information removed, we recommend requesting removal directly through your county’s website.
| Date | Buyer | Sale Price | Title Company |
|---|---|---|---|
| $240,000 | -- | ||
| $256,048 | None Available | ||
| $18,000 | None Available |
Mortgage History
We collect this data history from publicly available records. To have your information removed, we recommend requesting removal directly through your county’s website.
| Date | Status | Borrower | Loan Amount |
|---|---|---|---|
| Open | $223,850 | ||
| Previous Owner | $147,000 |
Tax History
We collect this data history from publicly available records. To have your information removed, we recommend requesting removal directly through your county’s website.
| Year | Tax Paid | Tax Assessment Tax Assessment Total Assessment is a certain percentage of the fair market value that is determined by local assessors to be the total taxable value of land and additions on the property. | Land | Improvement |
|---|---|---|---|---|
| 2025 | $798 | $235,500 | $0 | $0 |
| 2024 | $2,240 | $219,600 | $0 | $0 |
| 2023 | $2,683 | $202,800 | $0 | $0 |
| 2022 | $2,486 | $188,500 | $0 | $0 |
| 2021 | $2,613 | $179,950 | $0 | $0 |
| 2020 | $2,626 | $174,600 | $0 | $0 |
| 2019 | $2,776 | $174,600 | $0 | $0 |
| 2018 | $2,643 | $174,600 | $22,950 | $151,650 |
| 2017 | $2,371 | $174,600 | $151,650 | $22,950 |
| 2016 | $2,371 | $163,350 | $22,950 | $140,400 |
| 2014 | $3,153 | $293,500 | $45,900 | $247,600 |
Map
- 2265 80th St SE
- 2365 80th St SE
- 2435 80th St SE
- 2420 80th St SE
- 2425 80th St SE
- 7007 Butler Loop
- 7011 Butler
- 7008 Butler
- 6933 Butler Loop
- 2770/2780 Butler St
- 2730/2740 Butler St
- 2750/2760 Butler St
- 7680 Brightfield Dr
- 7700 Brightfield Dr
- 306 Hawk St
- 2325 Maple Ln
- 2320 Maple Ln
- 2380 Maple Ln
- 2220 Maple Ln
- 2225 Maple Ln
Ask me questions while you tour the home.