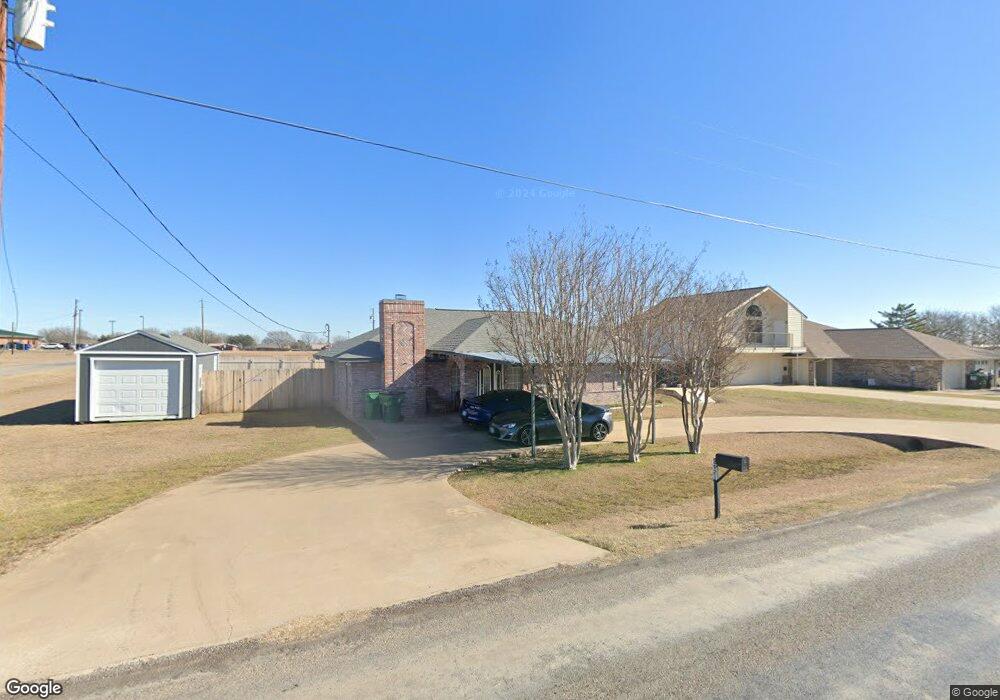
2921 James Rd Granbury, TX 76049
Estimated Value: $205,634 - $302,000
--
Bed
--
Bath
1,350
Sq Ft
$183/Sq Ft
Est. Value
About This Home
This home is located at 2921 James Rd, Granbury, TX 76049 and is currently estimated at $246,909, approximately $182 per square foot. 2921 James Rd is a home located in Hood County with nearby schools including Acton Elementary School, Acton Middle School, and Granbury High School.
Ownership History
Date
Name
Owned For
Owner Type
Purchase Details
Closed on
Oct 30, 2007
Sold by
Burton Glenn E and Burton Theresa A
Bought by
Fuller Susan L
Current Estimated Value
Home Financials for this Owner
Home Financials are based on the most recent Mortgage that was taken out on this home.
Original Mortgage
$95,918
Outstanding Balance
$60,381
Interest Rate
6.37%
Mortgage Type
Purchase Money Mortgage
Estimated Equity
$186,528
Purchase Details
Closed on
Aug 9, 2005
Sold by
Bratton Johnie
Bought by
Burton Glenn E and Burton Thereasa A
Home Financials for this Owner
Home Financials are based on the most recent Mortgage that was taken out on this home.
Original Mortgage
$83,686
Interest Rate
5.51%
Mortgage Type
FHA
Purchase Details
Closed on
Oct 17, 1994
Sold by
Needham Marc
Bought by
Jackson Susan L
Create a Home Valuation Report for This Property
The Home Valuation Report is an in-depth analysis detailing your home's value as well as a comparison with similar homes in the area
Home Values in the Area
Average Home Value in this Area
Purchase History
| Date | Buyer | Sale Price | Title Company |
|---|---|---|---|
| Fuller Susan L | -- | None Available | |
| Burton Glenn E | -- | None Available | |
| Jackson Susan L | -- | -- |
Source: Public Records
Mortgage History
| Date | Status | Borrower | Loan Amount |
|---|---|---|---|
| Open | Fuller Susan L | $95,918 | |
| Previous Owner | Burton Glenn E | $83,686 |
Source: Public Records
Tax History Compared to Growth
Tax History
| Year | Tax Paid | Tax Assessment Tax Assessment Total Assessment is a certain percentage of the fair market value that is determined by local assessors to be the total taxable value of land and additions on the property. | Land | Improvement |
|---|---|---|---|---|
| 2025 | $694 | $141,040 | $20,000 | $121,040 |
| 2024 | $636 | $131,747 | $20,000 | $124,500 |
| 2023 | $1,457 | $156,320 | $20,000 | $136,320 |
| 2022 | $1,048 | $142,740 | $12,000 | $130,740 |
| 2021 | $1,520 | $98,990 | $12,000 | $86,990 |
| 2020 | $1,547 | $100,120 | $12,000 | $88,120 |
| 2019 | $1,472 | $100,120 | $12,000 | $88,120 |
| 2018 | $1,339 | $82,340 | $12,000 | $70,340 |
| 2017 | $1,405 | $84,030 | $12,000 | $72,030 |
| 2016 | $1,377 | $82,340 | $12,000 | $70,340 |
| 2015 | $1,138 | $80,210 | $12,000 | $68,210 |
| 2014 | $1,138 | $80,210 | $12,000 | $68,210 |
Source: Public Records
Map
Nearby Homes
- 2918 James Rd
- 3510 Fountain Way
- 4920 Centre Ct
- 1141 Avery Rd
- 1144 Avery Rd
- 1136 Avery Rd
- 3218 Fountain Way
- 2925 Willow Ridge Cir
- 2936 Willow Ridge Cir
- 2608 Royal Ln
- 5003 Bueno Dr
- 4512 Cimmaron Trail
- 5700 N Highland Dr
- 3108 Windcrest Ct
- 5102 Largo Dr
- 1301 James Rd
- 2180 James Rd
- 3304 White Horse Dr
- 4363 Acton Hwy
- 4901 Fairway Ct