Estimated Value: $350,481 - $374,000
4
Beds
2
Baths
1,724
Sq Ft
$210/Sq Ft
Est. Value
About This Home
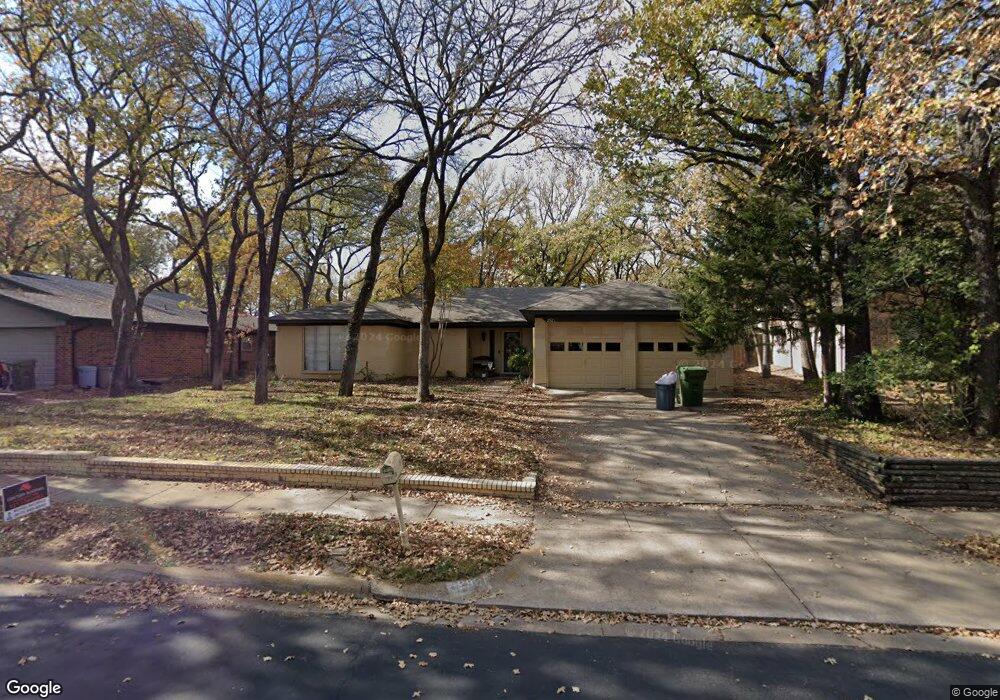
This home is located at 2921 Ridgewood Dr, Hurst, TX 76054 and is currently estimated at $361,870, approximately $209 per square foot. 2921 Ridgewood Dr is a home located in Tarrant County with nearby schools including W.A. Porter Elementary School, Smithfield Middle School, and Birdville High School.
Ownership History
Date
Name
Owned For
Owner Type
Purchase Details
Closed on
Jun 10, 2005
Sold by
Household Finance Corp Iii
Bought by
Sims Hal C and Sims Julie A
Current Estimated Value
Home Financials for this Owner
Home Financials are based on the most recent Mortgage that was taken out on this home.
Original Mortgage
$93,400
Outstanding Balance
$52,191
Interest Rate
6.87%
Mortgage Type
Purchase Money Mortgage
Estimated Equity
$309,679
Purchase Details
Closed on
Jan 4, 2005
Sold by
Mortgage Electronic Registration Systems
Bought by
Household Finance Corp Iii
Purchase Details
Closed on
Sep 28, 2000
Sold by
White Melva J
Bought by
Glosson Douglas Q
Home Financials for this Owner
Home Financials are based on the most recent Mortgage that was taken out on this home.
Original Mortgage
$88,000
Interest Rate
13.45%
Create a Home Valuation Report for This Property
The Home Valuation Report is an in-depth analysis detailing your home's value as well as a comparison with similar homes in the area
Home Values in the Area
Average Home Value in this Area
Purchase History
| Date | Buyer | Sale Price | Title Company |
|---|---|---|---|
| Sims Hal C | -- | -- | |
| Household Finance Corp Iii | -- | -- | |
| Mortgage Electronic Registration Systems | $107,640 | -- | |
| Glosson Douglas Q | -- | Metroplex Title Inc |
Source: Public Records
Mortgage History
| Date | Status | Borrower | Loan Amount |
|---|---|---|---|
| Open | Sims Hal C | $93,400 | |
| Previous Owner | Glosson Douglas Q | $88,000 | |
| Closed | Glosson Douglas Q | $22,000 |
Source: Public Records
Tax History Compared to Growth
Tax History
| Year | Tax Paid | Tax Assessment Tax Assessment Total Assessment is a certain percentage of the fair market value that is determined by local assessors to be the total taxable value of land and additions on the property. | Land | Improvement |
|---|---|---|---|---|
| 2025 | $7,625 | $335,620 | $60,000 | $275,620 |
| 2024 | $7,625 | $335,620 | $60,000 | $275,620 |
| 2023 | $7,558 | $330,711 | $60,000 | $270,711 |
| 2022 | $6,918 | $279,805 | $40,000 | $239,805 |
| 2021 | $6,558 | $252,797 | $40,000 | $212,797 |
| 2020 | $5,494 | $213,803 | $40,000 | $173,803 |
| 2019 | $5,620 | $213,803 | $40,000 | $173,803 |
| 2018 | $4,994 | $190,000 | $40,000 | $150,000 |
| 2017 | $5,245 | $196,563 | $40,000 | $156,563 |
| 2016 | $4,573 | $171,384 | $35,000 | $136,384 |
| 2015 | $3,696 | $137,800 | $20,000 | $117,800 |
| 2014 | $3,696 | $137,800 | $20,000 | $117,800 |
Source: Public Records
Map
Nearby Homes
- 2809 Sandstone Dr
- 2829 Sandstone Dr
- 2908 Steve Dr
- 2844 Hurstview Dr
- 2804 Ridgewood Dr
- 712 Springhill Dr
- 736 Springhill Dr
- 6801 Woodland Hills Dr
- 6704 Nob Hill Ct
- 6708 Nob Hill Ct
- 712 Springwood Dr
- 713 Paul Dr
- 2732 Woodbridge Dr
- 717 Reese Ln
- 3132 Hurstview Dr
- 405 Bremen Dr
- 6521 Rock Springs Dr
- 2668 Bent Tree Dr
- 312 Bremen Dr
- 7020 Live Oak Dr
- 2917 Ridgewood Dr
- 2925 Ridgewood Dr
- 2920 Steve Dr
- 2916 Steve Dr
- 2924 Steve Dr
- 2913 Ridgewood Dr
- 2929 Ridgewood Dr
- 2920 Ridgewood Dr
- 2924 Ridgewood Dr
- 2916 Ridgewood Dr
- 2912 Steve Dr
- 2928 Steve Dr
- 2909 Ridgewood Dr
- 2912 Ridgewood Dr
- 2933 Ridgewood Dr
- 2928 Ridgewood Dr
- 2932 Steve Dr
- 2908 Ridgewood Dr
- 2861 Autumn Dr
- 2905 Steve Dr